Course in Canvas Commons (16 week version)
Stats: A playlist of statistical videos
Introduction to Statistics Using Google Sheets™ Edition 6.1
Term | LMS | Final examination topic
Spring 2023 sn1 calendar and syllabus Canvas
Fall 2022 sm3 calendar and syllabus Canvas: Stair steps
Summer 2022 sm2 calendar and syllabus Canvas: Lelu
Spring 2022 sm1 calendar and syllabus Canvas: PM 2.5
Fall 2021 sl3 calendar and syllabus Canvas: Hula hoops
Summer 2021 sl2 calendar and syllabus Canvas: Page views
Spring 2021 sl1 calendar and syllabus Canvas: Disengagement
Fall 2020 sk3 calendar and syllabus Schoology: Cash power
Summer 2020 sk2 calendar and syllabus Schoology: UA redux
Spring 2020 sk1 calendar and syllabus Classes ended March 16: pandemic
Fall 2019 sj3 calendar and syllabus Schoology: UA HOVR Guardian
Spring 2019 sj1 calendar and syllabus Schoology: iNaturalist
Fall 2018 si3 calendar and syllabus Schoology: Insight Timer data
Spring 2018 si1 calendar and syllabus Schoology: Rainfall data
Fall 2017 sh3 calendar and syllabus Schoology: Dausokele run data
Spring 2017 sh1 calendar and syllabus Schoology: Moves app steps, cadence vs. speed
Fall 2016 sg3 calendar and syllabus Schoology: Harrassment definition survey results
Summer 2016 sg2 calendar and syllabus Schoology: Prince and Stairway to Heaven
Spring 2016 sg1 calendar and syllabus
• t01
• t02 mx
• t03
• t04 fx purple
Fall 2015 sf3 calendar and syllabus
• t01
• t02 mx
• t03
• t04 fx MAD
Spring 2015 sf1 calendar and syllabus
• t01
• t02 mx
• t03
• t04 fx running mileage
Fall 2014 se3 calendar and syllabus
• t01
• t02 mx
• t03
• t04 fx United
Spring 2014 se1 calendar and syllabus
• t01
• t02 mx
• t03
• t04 fx bermudagrass
Fall 2013 sd1 calendar and syllabus
• t01
• t02 mx
• t03
• t04 fx sweetie-chuuk
Spring 2013 sd1 calendar and syllabus
• t01
• t02 mx
• t03
• fx olmchs-relay
Fall 2012 sc3 calendar and syllabus
• t01
• t02 mx
• t03
• t04 fx solar-nitrogen [odx]
Spring 2012 sc1 calendar and syllabus
• t01
• t02 mx
• t03
• fx topper
Fall 2011 sb3 calendar and syllabus
• t01
• t02 mx
• t03
• fx waves
Spring 2011 sb1 calendar and syllabus
• t01
• t02 mx
• t03
• fx mansuit
Fall 2010 sa3 calendar and syllabus
• t01
• t02 mx
• t03
• fx kosrae pop
Introduction to Statistics Using LibreOffice.org Calc, Apache OpenOffice.org Calc, and Gnumeric Edition 5.3 [deprecated]
Links for mobile accessibity [deprecated]
| Fall 2005 | |
|---|---|
| Spreadsheets | Quizzes and Tests |
|
Calendar BFI xls • html • ods rain.ods Frequency function Another frequency explanation • xls Homework 3.2 p100 • html • ods Drop bounce xls • html • ods Run to NBFS • html • ods raise one eyebrow • html • ods Pohnpei population 1958 • html • ods Pennies • html • ods PICS CHS normal 7.3 PICS CHS normal 7.3 • ods Guava leaf lengths Guava confidence intervals Hypothesis test worksheet BFI paired t-test • html • ods Fibobelly 11.3 • html • ods p488 #1 • html • ods Belly button ratio: M9 Belly button ratio: M9 & M10 |
Q01 1.1 Q02 2.2 • html Q03 3.2 • html t1 4.2 • html Q04 4.2 • html Q05 6.1 • html Mx 6.1 • html Q07 7.3 • html q08 9.2 t2 9.4 • html q09 9-10 • q10 10 • q11 11.1 q12 r4.3 html Faraway Rainbow data • html Generating spreadsheet • xls |
| Spring 2005 | |
|---|---|
| Spreadsheets | Quizzes and Tests |
|
calendar bfi • html • sxc Pop data • html • sxc 8 bin hw • html • sxc run hw data run html sxc Yap 47 • html • sxc substance use • html • sxc Pennies tracklanes • sxc Pick ten • html • sxc • ods ci to hypothesis test Kosrae High School HS data • + stats Duke Kahanamoku xll • xla1 • xla2 • xla3 ADV XHS CCA Lap worksheet • ans • sxc |
Quiz 1 q2 2.1 • html t1 2.2 • html Q3 4.2 • Q4 5.1 • Q5 6.1 Mx 6.3 • html q06 6.1 • html q07 7.3 q08 9.2 • html t2 • t2a • html q9 hyp test • html q10 binom hyp • sxw • odt q11 r4.3 • Some solns q12 r3.2 + ci Fish • data sheet • ods • html |
| Fall 2004 | |
|---|---|
| Spreadsheets | Quizzes and Tests |
|
Calendar BFI • html • sxc High School • html • sxc Body fat HW • html • sxc Central tendency handout sxc • xls Track laps central tendency hw ans • html • sxc lin reg hw • html • sxc bounce ans • html • sxc Non-linear regression Infant mortality homework xls • html • sxc Mean from RF • html • sxc xls • html • sxc Track laps redux • html • sxc ans • html • sxc track laps normal • html • sxc PICS essay • html • sxc Normal statistics with curve Sample mean normal statistics with curve • sxc Female bfi homework roasting coffee homework z versus t confidence interval Confidence interval based on t t ci bats! ci to hypothesis Duke paired t-test Bats Daily temps for Pohnpei for 47 years! |
Quiz 1 1.2 •
Quiz 2 2.1 t1 2.2 • html q3 3.2 • q4 4.3 q5 6.1 • html MX Tires • html q6 7.2 q7 7.3 • q7a t2 7.3 • q8 9.1 • xls q9 ci hyp test 9-10 q10 hyp test q11 r4.3 • q11a q12 • html • oos Fitness • html |
| Spring 2004 | |
|---|---|
| Spreadsheets | Quizzes and Tests |
|
Calendar Charts • html • sxc Linear xls • html • sxc M&M's® xls • html • M&M's® web site • sxc z to x • Normal statistics High School data • sxc Body fat end m9 • m10 V = iR 3.3 review • html • sxc • sxw |
q1 1.1 q2 1.4 • q2a t1 2.2 • html q3 3.2 • html q4 4.1 q5 5.1 • html Mx 5.1 • html html q07 6.1 t2 6.3 q8 7 • q9 82 q10 94 q11 r3.3 (s23q3 s23q10) html Golfdrop fx • ans |
| Quizzes, Tests, Midterms, and Finals | ||
|---|---|---|
| Fall 2003 | Spring 2003 | Fall 2002 |
|
q01 1.1 •
q02 1.4 q02 ans • t1 2.2 • t1 2.2a q03 3.3 • q04 4.1 Mx 5.1 • html WS q05 • html q06 6.2 • t2 6.3 q07 8.1 • html q08 8-9 • q09 3.3rev ws10 1.4 5.1 • html s33q11 • html Whirlpool fx • ans |
Q1 1.1 •
Q2 1.4 Bins T1 2.2 • T1 Ans Q3 3.1 • Q4 3.3 4.1 Midx 5.1 • Mx Ans District two 2003 Penny distribution Q5 5.1 6.1 • Q6 6.3 T2 6 8.2 Q8 8.1 Q9 9.1 Q10 3.3 Revisited Freeway fx Dev worksheet |
Q01 1.1 •
Q02 1.4 Test 1 2.2 Q03 3.3 • Q04 4.1 Midterm 4.1 • Q05 5.1 • Penny lab results Q06 6.2 • T2 6.3 Q07 8.1 • Q08 8 - 9 Q09 9.4 • Q10 3.3r Tuna CPUE fx • fxa |
| Support Materials | ||
|---|---|---|
| Fall 2003 | Spring 2003 | Fall 2002 |
|
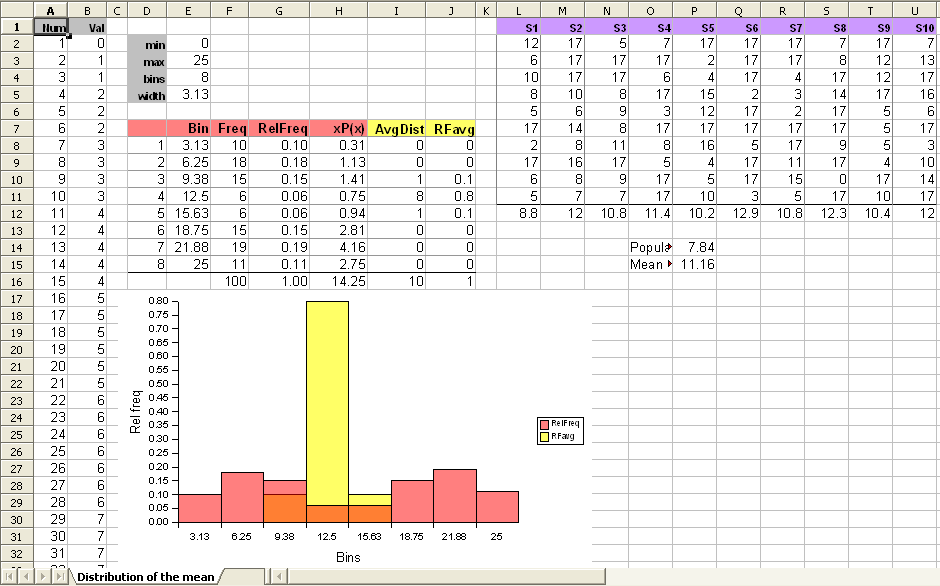
Calendar Body Fat Data • html • sxc Pop. Pareto • (html) PE Survey sxc Female BFI histo from class Male body fat histo • html • sxc Utwe 2.2 handout • html • sxc Soy Sauce Worksheets Soysauce example • html • sxc Waikiki Soy xls • html • sxc Soy Data M09 xls • html • sxc Soy data M10 xls • html • sxc Alcohol xls • html • sxc Pennies • PNG • sxc Normal statistics • sxc Distribution of the mean Poll Conf Int • Pulse • sxc |
Calendar/Syllabus Course Outline Excel OpenOffice Calc Age Hist 5.1 xls Norm dist xls • html • sxc Homework exemplar Mean Dist • png • sxc Entrance ci worksheet Conf Interval 8.2 for 14 April Paired Mean WS • sxc • T-test: Two sample for means |
Excel Calendar |
| Spring 2002 | Fall 2001 | Summer 2001 | Spring 2001 | Fall 2000 |
|---|---|---|---|---|
|
Excel Calendar |
Excel Syllabus |
Excel |
Excel Syllabus Non-linear curve |
Excel Calendar |