The first section of this final examination assess whether you can make basic statistical computations. For the purposes of this section any set of numbers will do. The following is the number of times ⚥ played a particular song in concerts over the course of his lifetime. The number of times a song was played is based on actual performance set lists. Use the data in the second column, the number of times a song was played, for this first section of the final.
Song
SetList count
Purple Rain
1005
Kiss
758
Let's Go Crazy
701
1999
638
Little Red Corvette
632
Take Me With U
608
When Doves Cry
540
Raspberry Beret
537
Controversy
536
Baby I'm a Star
488
Nothing Compares 2 U
423
Do Me, Baby
421
U Got the Look
410
Delirious
368
The Beautiful Ones
368
I Would Die 4 U
355
What is the highest level of measurement that this data could be considered to be?
Calculate the sample size n:
Calculate the minimum:
Calculate the first quartile Q1:
Calculate the median:
Calculate the third quartile Q3:
Calculate the maximum:
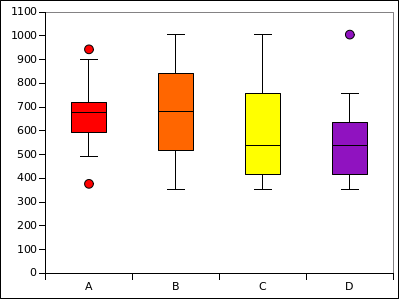
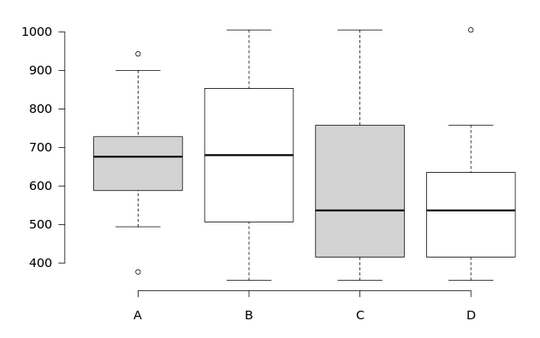
Which of the following is the correct box and whisker plot with outliers for this data? Note that the two images are of the same data, they were produced with two different tools.
Calculate the range:
If the data is divided into five classes, calculate the width of a single class:
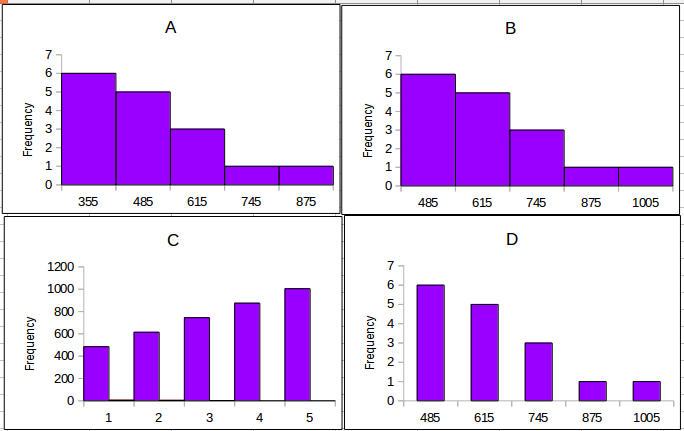
Calculate the class upper limits and the frequencies for the data using five classes. Use these results to choose the correct frequency histogram.
What is the shape of the histogram?
Calculate the mode:
Calculate the mean. Keep two decimal places:
Calculate the sample standard deviation sx. Keep two decimal places:
Calculate the standard error SE of the sample mean. Keep two decimal places:
Calculate t-critical for a 95% confidence level. Keep two decimal places:
Calculate the margin of error E of the sample mean. Keep two decimal places:
Calculate the lower bound for the 95% confidence interval for the population mean μ. Round to a whole number:
Calculate the upper bound for the 95% confidence interval for the population mean μ. Round to a whole number:
The data for the band setlist below has a mean of 238.6875. Use the above 95% confidence interval to test whether the population mean for ⚥ could be 238.6875:
H0: µ = 238.6875
H1: µ ≠ 238.6875
Do you reject or fail to reject the null hypothesis at an alpha of 5%? Note that the connection between the artists is ⚥ playing the second song in the following setlist.
Song
Setlist count
Dazed and Confused
438
Whole Lotta Love
314
Moby Dick
312
Since I've Been Loving You
299
Stairway to Heaven
271
Communication Breakdown
266
Heartbreaker
255
Black Dog
229
White Summer/Black Mountain Side
221
Rock and Roll
211
How Many More Times
199
I Can't Quit You Baby
185
The Song Remains the Same
173
Train Kept A-Rollin'
154
You Shook Me
147
Over the Hills and Far Away
145
The stairs and platforms below are known as the Haiku stairs or "The Stairway to Heaven" in some circles. The stairs climb Pu'u Keahi a Kahoe on Oahu. In keeping with the non-serious nature of the data in this final, the following is a linear regression exercise based on data from thte steepest section of the stairs seen above.
Mile marker
Height (feet)
3.5
1000
3.7
1900
4.1
2000
4.5
2800
For the paired data, calculate the sample size n:
Calculate the slope. Round to a whole number:
Calculate the y-intercept. Round to a whole number, retain the negative sign if any:
Calculate the correlation coefficient r for the data. If the correlation is negative, include the negative sign, rounding your answer to two decimal places.
Is the correlation none, weak/low, moderate, strong/high, or perfect?
Use the slope and intercept to predict the height at the 3.9 mile marker. Round your result to a whole number:
A family in Madolehnihmw has a child in the eighth grade who enjoys to write and is a good writer. The parents want to send their child to a high school that potentially produces good writers. The only data the parents have to work with are the essay scores on the spring 2016 COMET entrance examination. The parents have narrowed their choice down to choosing between Our Lady of Mercy Catholic High School and Madolenihmw High School. Use the data to help advise the parents in making their choice.
Which high school produced the higher COMET essay scores (total possible 50)? Based on what?
Is the difference significant? Why?
Based only on the COMET essay score data, which school, if either, should the child be sent to? Why?
OLMCHS
MHS A
33
39
36
28
35
34
38
35
28
42
36
40
49
34
49
47
33
42
44
35
47
48
33
40
36
37
33
42
48
39
29
41
48
40
37
30
37
42
43
45
35
35
36
Do not simply write down any and all statistics you have ever learned. Cite specific statistics or charts that support that answer. When citing a statistic or statistics, include both the name of the statistic, the numeric value, and why that statistic is meaningful.