| Month | Mileage |
|---|
| August | 149.18 |
| September | 128.4 |
| October | 97.18 |
| November | 119.72 |
| December | 116.28 |
| January | 124.56 |
This midterm intentionally uses a small set of values. The intent is only to measure your ability to carry out basic statistical calculations and procedures. For this purpose any set of values would work, in this instance I borrowed my monthly running mileage as recorded by a NikePlus running app. Between 29 July 2015 and 29 January 2016 I ran every day, accumulating on the order of hunded miles of running per month over the six month period. The data is in the second column of the table, my monthly cumulative mileage.
- What level of measurement is the data in the second column?
-
What is the sample size?
-
Determine the mode.
-
Calculate the median.
-
Calculate the mean.
-
Calculate the sample standard deviation sx.
-
Calculate the coefficient of variation CV.
-
What is the minimum?
-
What is the maximum?
-
Calculate the range:
-
If the data is divided into five classes for a histogram, what is the width of one class?
-
Calculate the five class upper limits, the frequencies and the relative frequencies for the data. Identify the correct frequency/relative frequency table in the image.

-
If a five class frequency histogram chart was produced from the data, what would be the shape of the histogram?
-
Calculate the first quartile.
-
Calculate the third quartile.
-
Calculate the InterQuartile Range.
-
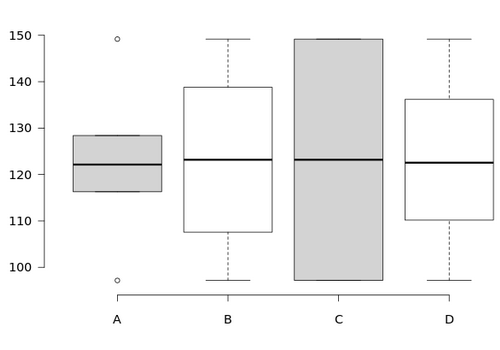
Which box and whisker plot correctly displays the data? Suggestion: Use BoxPlotR.
-
The box and whisker plot suggests that...
a ...my monthly mileage amounts are fairly evenly spaced between the minimum and maximum values with no unusual values
b ...my monthly mileage amounts for August and October were unusual values
On January ninth a runner ran 7.13 miles. The NikePlus app provided speed data for each mile on that run. The paired data reports the mile and the speed in centimeters per second for each mile of the run.
| Distance (miles) | Speed (cm/s) |
|---|
| 1 | 265 |
| 2 | 260 |
| 3 | 263 |
| 4 | 263 |
| 5 | 265 |
| 6 | 268 |
| 7 | 266 |
- What is the sample size for this data?
-
Calculate the slope for a linear trend line.
-
Calculate the y-intercept for a linear trend line.
-
Calculate the correlation coefficient r for the data.
-
What percentage of the variation seen in the distance data accounts for the variation seen in the speed data?
-
What is the strength of the relationship?
-
What is the probability of rolling a five on a ten-sided die numbered from 0 to 9?