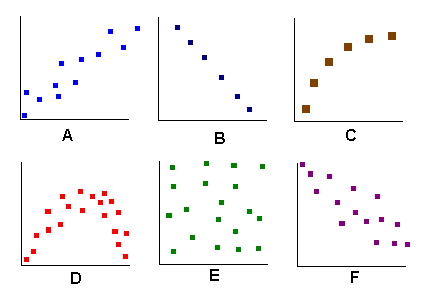

For the above six graphs circle the correct word applicable to that graph in each column:
| Shape of correlation | Amount of correlation | If linear, the correlation sign is... | |
|---|---|---|---|
| A | none | linear | non-linear | none | moderate | high | not linear | positive | negative |
| B | none | linear | non-linear | none | moderate | high | not linear | positive | negative |
| C | none | linear | non-linear | none | moderate | high | not linear | positive | negative |
| D | none | linear | non-linear | none | moderate | high | not linear | positive | negative |
| E | none | linear | non-linear | none | moderate | high | not linear | positive | negative |
| F | none | linear | non-linear | none | moderate | high | not linear | positive | negative |
For the following data, determine the slope and intercept of the line that best fits the data:
| x | y |
|---|---|
| 0 | 0 |
| 20 | 3 |
| 33 | 6 |
| 55 | 10 |
| Statistic or Parameter | Symbol | Equations | Excel |
|---|---|---|---|
| Square root | =SQRT(number) | ||
| Sample size | n | =COUNT(data) | |
| Minimum | =MIN(data) | ||
| Maximum | =MAX(data) | ||
| Median | =MEDIAN(data) | ||
| Mode | =MODE(data) | ||
| Sample mean | Sx/n | =AVERAGE(data) | |
| Population mean | m | SX/N x P(x) n p (binomial) |
=AVERAGE(data) |
| Sample standard deviation | s sx sxn-1 |
=STDEV(data) | |
| Population standard deviation | s sx sxn |
=STDEVP(data) | |
| Sample variance | (sx)² | =VAR(data) | |
| Population variance | s² | =VARP(data) | |
| Sample Coefficient of Variation | CV | 100(sx/ |
=100*STDEV(data)/AVERAGE(data) |
| Slope | b | =SLOPE(y data, x data) | |
| Intercept | a | =INTERCEPT(y data, x data) | |
| Correlation | r | =CORREL(y data, x data) | |
| Coefficient of Determination | r² | =(CORREL(y data, x data))^2 |