034 • Name:
| Posts |
|---|
| 188 |
| 213 |
| 217 |
| 242 |
| 243 |
| 243 |
| 253 |
| 271 |
| 277 |
| 228 |
| 247 |
| 200 |
| 278 |
| 233 |
| 213 |
| 239 |
| 243 |
| 242 |
| 232 |
| 224 |
| 241 |
| 244 |
| 243 |
| 242 |
| 241 |
| 242 |
| 243 |
-
Determine the level of measurement for the data:
-
Determine the sample size:
-
Determine the mode:
-
Determine the median:
-
Calculate the mean and enter your answer rounded to two decimal places:
-
Calculate the midrange:
-
Calculate the sample standard deviation sx and enter your answer rounded to two decimal places.
-
Calculate the sample coefficient of variation CV and enter your answer rounded to three decimal places.
-
Determine the minimum:
-
Determine the maximum:
-
Calculate the range:
-
If the range is divided into five classes, what is the width of a single class?
-
Make a five class frequency table for the data.
-
Which of the following is the correct frequency histogram for the airport data?
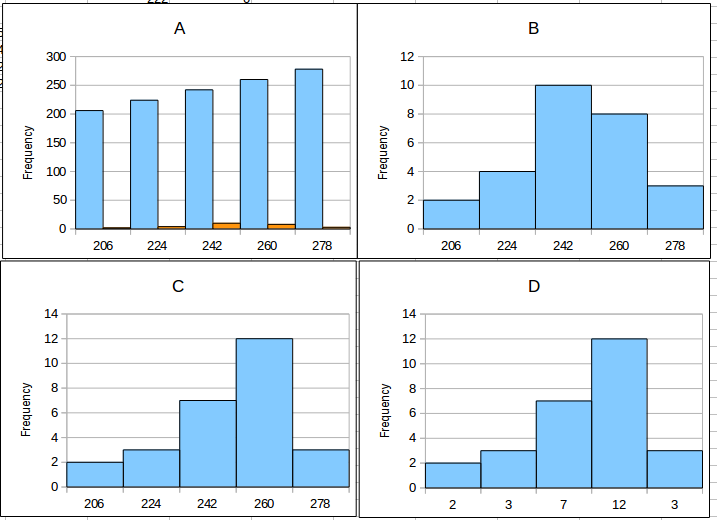
-
What is the shape of the distribution displayed in the histogram?
-
Calculate the first quartile using the spread sheet function value:
-
Calculate the third quartile using the spread sheet function value:
-
Calculate the InterQuartile Range:
-
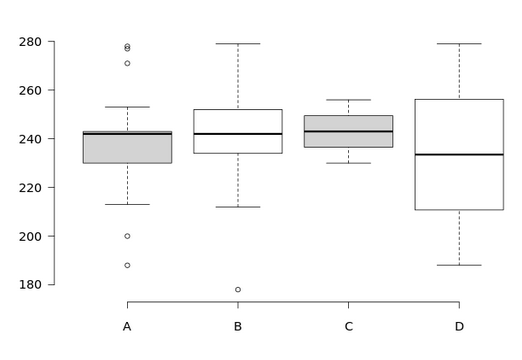
Which of the following box and whisker plots correctly displays the data? Suggestion: Use BoxPlotR.