- Our College
- Academics
- Student Services
- Public Reports
- Forum
- Library
- Quick Access
Program Student Learning Outcomes (PSLOs)
At the completion of the Micronesian Studies Program, the student will be able to:
PSLO Assessment Report Summary
What we looked at:
PSLO 4 was identified to be assessed for the 2016-2017 cycle based on the previous assessments and recommendations.
PSLO 4 was assessed, using final research papers in two research courses in the program. The courses include Research methods (SS200) and Directed Study (SS280). The rubric looked at the following criteria: Thesis formulation, reliability of sources, analysis, synthesis, and process. Each category will be worth 4 points.
What we found:
PSLO # 4. Demonstrate the ability to perform research and write papers relevant to Micronesia, using different methods and technologies.
The target for successful achievement was that 70% of the class met the outcome with a score of 70% or higher. Figures 1 & 2 show the results.
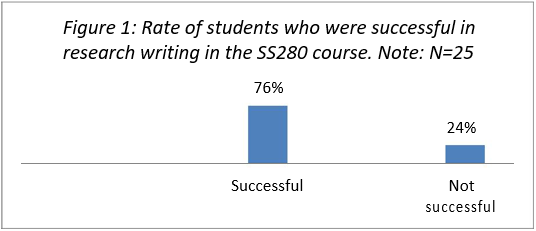
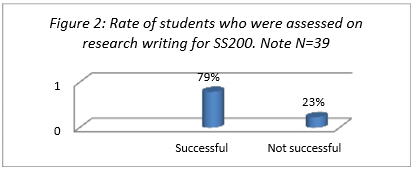
Table 1 shows average scores on each performance category for Research writing for SS280 Directed study course for both Fall2016 and Spring 2017 semesters.
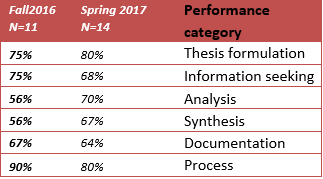
Assessment results in both semesters reveal that Analysis continues to be the weakest area, while Thesis formulation remains the strongest area. Detailed results of students rating on the seven areas are stated in Tables 1 &2.
Results show an improvement in both analysis and synthesis performances. Although the average score for synthesis category is at 67%, the outlook is positive because the performance is much higher than what was seen in Fall2016, which was a 56%. The slight improvement can be attributed to the change instructors made by giving more critical thinking exercises, beginning in the SS200 Research methods course. The change to focus on building critical thinking skills culminated from several earlier program assessment results, both from common essay assessment and research papers. It is also positive to note that the students’ ability to formulate thesis remains the strongest (80%) area of performance. Interestingly, there is a slight decrease on how students handled the use of sources, as indicated by the results for the categories on Information seeking and documentation. A possible guess for this could be the confusion students have between using MLA format from their expository writing courses, and APA format in the Social Science research courses.
Table 2 shows average scores on Assessment of Research writing for SS200 Research methods course for both Fall2016 and spring 2017 semesters.
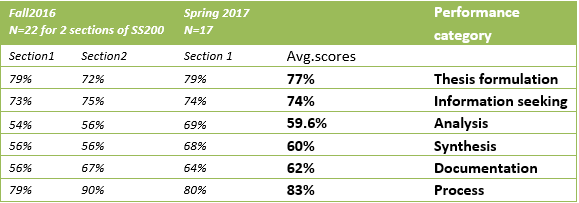
Students repeatedly show weakest performance in Analysis and Synthesis (59.6% and 60%) as average scores, as Thesis formulation and Process remain the strongest areas (77%, 83%) respectively. It has been observed that students come in with either little or no analytical skill. Another observation is that even collecting the correct sources of information is already a challenging task for students who enroll in the course. As a result, much of the tasks in the earlier weeks of the course are spent on helping students collecting and evaluating sources. The tasks involve collecting sources, and then determining the type of source, its validity, and reliability. A set of questions is used to help students perform the tasks.
Other assessment:
Each semester students taking SS280 are given an exit survey questionnaire to assess their overall experiences of the Micronesian studies program. The questions and their results, from both Fall2016 and Spring 2017 are seen on tables 3 & 4. Additional information that was also collected from the survey included students plans after completing the Micronesian studies program. Results are seen in Table 5.
Table 3 shows survey results from SS280 class for Fall2017.
| QUESTIONS | Strongly disagree | Disagree | Neutral | Agree | Strongly agree |
| 1. Instructors in your Micronesian studies program courses demonstrated knowledge of content | 2 | 9 | |||
| 2. Instructors in your Micronesian studies program courses seemed to sincerely care about you and your progress in your classes. | 1 | 10 | |||
| 3. Classroom atmosphere in your Micronesian studies classes seemed comfortable and supportive. | 3 | 8 | |||
| 4. Your grades in Micronesian studies program courses were an accurate assessment of your performance and mastery of subjects. | 3 | 8 | |||
| 5. You Micronesian studies program advisor was available to assist you when needed. | 1 | 2 | 8 | ||
| 6. Your Micronesian studies program advisor seemed to care about you and helped you to meet your academic goals. | 2 | 9 | |||
| 7. Your Micronesian studies program advisor helped you select courses that ensured you met graduation requirements. | 2 | 9 | |||
| 8. Your Micronesian studies program advisor assisted you with continued educational and career planning. | 3 | 8 | |||
| 9. You feel confident with the skills you acquired in the Micronesian studies program AA degree program for successful transfer to a 4-year college/university. | 3 | 8 | |||
| 10. You feel confident with the skills you acquired in the Micronesian studies program AA degree program to successfully obtain and maintain a job in this field. | 1 | 2 | 8 | ||
| 11. You feel that you increased your ability to design and conduct field studies in Micronesian studies program. | 2 | 9 | |||
| 12. You felt your experience in Micronesian studies program courses was enjoyable. | 1 | 10 | |||
| 13. You feel that the resources (e.g. textbooks, computer lab, classroom, etc.) in the program was adequate. | 1 | 10 | |||
| 14. You feel that you received a broad and adequate introduction to the Micronesian studies program after completing this program. | 3 | 8 |
Table 4 shows survey results from SS280 class for Spring 2017.
| QUESTIONS | Strongly disagree | Disagree | Neutral | Agree | Strongly agree |
| 1. Instructors in your Micronesian studies program courses demonstrated knowledge of content | 13 | ||||
| 2. Instructors in your Micronesian studies program courses seemed to sincerely care about you and your progress in your classes. | 13 | ||||
| 3. Classroom atmosphere in your Micronesian studies classes seemed comfortable and supportive. | 1 | 2 | 10 | ||
| 4. Your grades in Micronesian studies program courses were an accurate assessment of your performance and mastery of subjects. | 3 | 10 | |||
| 5. You Micronesian studies program advisor was available to assist you when needed. | 1 | 3 | 9 | ||
| 6. Your Micronesian studies program advisor seemed to care about you and helped you to meet your academic goals. | 2 | 11 | |||
| 7. Your Micronesian studies program advisor helped you select courses that ensured you met graduation requirements. | 1 | 2 | 10 | ||
| 8. Your Micronesian studies program advisor assisted you with continued educational and career planning. | 3 | 10 | |||
| 9. You feel confident with the skills you acquired in the Micronesian studies program AA degree program for successful transfer to a 4-year college/university. | 13 | ||||
| 10. You feel confident with the skills you acquired in the Micronesian studies program AA degree program to successfully obtain and maintain a job in this field. | 13 | ||||
| 11. You feel that you increased your ability to design and conduct field studies in Micronesian studies program. | 13 | ||||
| 12. You felt your experience in Micronesian studies program courses was enjoyable. | 1 | 12 | |||
| 13. You feel that the resources (e.g. textbooks, computer lab, classroom, etc.) in the program was adequate. | 1 | 1 | 11 | ||
| 14. You feel that you received a broad and adequate introduction to the Micronesian studies program after completing this program. | 1 | 12 |
Table 5 shows student-transfer information
| Exit survey | Fall 2016 | Spring 2017 |
| Returning to COM-FSM for a 2nd degree | 4 | 4 |
| Transferring to another university | 1 | 5 |
| Joined the US military | 1 | 0 |
| Transferring sometime in the future | 5 | 4 |
| Total | 11 | 13 |
What we are planning to work on:
AP Full Official |
Micronesian Studies Program |
||
Campus |
National campus |
AP Review Submission |
September 23, 2016 |
Completed by |
Delihna Manuel Ehmes |
AR Review Cycle |
Fall2014-Spring 2016 |
Program Goals |
|||
Program goals are broad statements concerning knowledge, skills, or values that the faculty members expect the graduating students to achieve. |
|||
• Students know the basic concepts of Micronesian history, society, government & politics, economy and culture. |
|||
Program History |
|||
This section describes the history of the program. This includes the date and reason of implementation, significant milestones in the development of the program, and significant current activities. |
|||
The Micronesian Studies A.A. Degree Program was established in 1999 and had its first graduates in 2001. Since then, the program has had more than 100 students enrolled per semester and has ranked third in most enrolled Associate Degree at the College. In a report from the office of Admissions and records, 60 students completed program between Fall2016 to Spring 2016. In the recent past, the program has seen a decline in its numbers. However, this is a trend that is seen across many programs here at the college. Part of this may be linked to increased emigration in the FSM. Even given this challenge in enrollment, the program has been able to prepare students to transfer into other programs at COM-FSM, other higher educational institutions outside of FSM, and into the labor market, as will be reflected in the transfer data in this report. |
|||
Program Description |
|||
The program description describes the program, including its organization, relationship to other programs in the system, program design, degree(s) offered, and other significant features of the program, such as elements/resources for forward-looking new program contributions to the state’s economy, or specialized program accreditation. |
|||
This program is designed to give students an in-depth knowledge and understanding of Micronesian history, society, government & politics, economy and culture. The A.A. degree prepares students to work in national or state government and politics, to be an elementary or high school social studies teacher, and in general to be more informed citizens of their state and nation. The program also has proven transferability to a wide range of majors at four-year colleges in the Pacific and the U.S. mainland.
|
|||
Program Admission Requirements |
|||
This section describes the requirements for admission into the program and other requisites. |
|||
To be matriculated into a program, applicants for admission must meet all of the following admission requirements:
As per the 2015-2016 college catalog under admission to associate of arts programs. |
|||
Program Certificate/Degree Requirements |
|||
This section specifies the requirements for obtaining a certificate/degree in the program, including specific courses,, sequencing of courses, total credits, internships, practical, etc. |
|||
General Education Core Requirements .................................................................................................29 Credits
{Choose from any course in art, music, history, culture, literature, philosophy, or language (3)} Major Requirements ..............................................................................................................................27 Credits Open Electives..........................................................................................................................................6 Credits Total Program Credits……………………………………………………………………………………………..62 Credits MICRONESIAN STUDIES First Semester Second Semester Summer Session Third Semester Fourth Semester Total Credits…………………………………….12 As per the College of Micronesia-FSM General Catalog 2015 - 2016 Associate of Arts Micronesian Studies Program. |
|||
Program Courses and Enrollment |
|||
This section lists courses offered in the program, including number of sections, course enrollment, section fill rates, and redundancy of courses across the institution. |
|||
In addition to the standard General Education Core Requirements, Micronesian Studies Majors must take the following courses: 2 open electives (100 level)
|
|||
Program Faculty |
|||
This section reports the faculty of the program, including full-time and part-time faculty. The degrees held and rank are provided for the full-time and part-time faculty. Finally, provide the faculty student ratio for the program. |
|||
Lucia N. Donre, Full-time Professor (began Spring 2011), BA Sociology (University of Hawaii at Hilo) and Masters in Educational Leadership (San Diego State University) Part time faculty Note: As of writing the division has a vacancy for one instructor position.
Table 1
Faculty-student ratio is typically 1/25 on semester basis. This ratio is based on other Social science courses that are also taught by the faculty in the program. Note: Enrollment data only reflect regular semesters from Fall2014-Spring 2016. |
Program Indicators |
|||||||||||||||||||||||||||||||||||||||||||||||||||||||||||||||||||||||||||||||||||||||||||||||||||||||||||||||||||||||||||||||||||||||||||||||||||||||||||||||||||||||||||||||||||||||||||||||||||||||||||||||||||||||||||||||||||||||||||||||||||||||||||||||||||||||||||||||||||||||||||||||||||||||||||||||||||||||||
This section provides the data for analyzing the extent to which the program has achieved the established outcomes and criteria. This is the most important part of the program review. The data that will be collected and evaluated are the following: |
|||||||||||||||||||||||||||||||||||||||||||||||||||||||||||||||||||||||||||||||||||||||||||||||||||||||||||||||||||||||||||||||||||||||||||||||||||||||||||||||||||||||||||||||||||||||||||||||||||||||||||||||||||||||||||||||||||||||||||||||||||||||||||||||||||||||||||||||||||||||||||||||||||||||||||||||||||||||||
Assessment of course student learning outcomes of program courses |
The data reported here are derived from course level assessment results that employed several tools of assessment on the Course Student Learning Outcomes (CSLOs). Results reflect assessment of the Micronesian studies required courses within a 2-year cycle, from Fall 2014-Spring 2016. Tools of assessment include formative assessment (i.e., quizzes, chapter tests, assignments, in-class work, and presentations) and summative assessment (i.e., comprehensive exams and final research papers). Findings Figures below show results of assessment for each Micronesian study course from Fall 2014-Spring 2016. The N represents the total number of students assessed on each outcome. Figures represent percentage of students who successfully met each outcome for semesters Fall2014-Spring 2016. For all SS courses, successful achievement of outcome means that 70% of the class meet an outcome with a 70% or better.
Table 1 represents assessment results of CSLO for SS101-Political science, across 4 semesters.
Table 2 represents assessment results of CSLO for SS120-Introduction to geography,
Table 3 represents assessment results of CSLO for SS125-Pacific geography,
Table 4 represents assessment results of CSLO for SS195-Micronesian cultural studies,
Table 5 represents assessment results of CSLO for SS200-Research methods, across 4 semesters.
Table 6 represents assessment results of CSLO for SS205-Micronesian government and politics, across 4 semesters.
Table 7 represents assessment results of CSLO for SS212-Economy of Micronesia, across 4 semesters.
Table 8 represents assessment results of CSLO for SS220-Contemporary issues in Micronesia, across 4 semesters.
Table 9 represents assessment results of CSLO for SS280-Directed study, across 4 semesters.
Analysis |
||||||||||||||||||||||||||||||||||||||||||||||||||||||||||||||||||||||||||||||||||||||||||||||||||||||||||||||||||||||||||||||||||||||||||||||||||||||||||||||||||||||||||||||||||||||||||||||||||||||||||||||||||||||||||||||||||||||||||||||||||||||||||||||||||||||||||||||||||||||||||||||||||||||||||||||||||||||||
Assessment of program student learning outcomes |
Results below are Program Assessment Summaries (PASs) of both academic years 2014-2015 and 2015-2016, showing what the program faculty did as part of Learning outcomes. PSLO Assessment Report Summary (Academic year 2014-2015) What we looked at: PSLO 2 was assessed, using pre and posttests with a scoring rubric, in SS introductory courses. The aim is to assess students’ knowledge on major concepts in the SS courses at the beginning and at the end of a course. The courses assessed include Introduction to Political Science ( SS101), Introduction to Geography (SS120), Geography of the Pacific (SS125), and Micronesian Cultural Studies (SS195). PSLO 3 was assessed, using reflective writing which focuses on students’ understanding of specific course concepts. The courses assessed include Micronesia Cultural Studies (SS195), Micronesia Government & Politics (SS205), Economy of Micronesia (SS212) and Contemporary Issues in Micronesia (SS220).. The rubric rated students’ knowledge, reasoning, and communication of the core concepts for each course. PSLO 4 was assessed, using final research papers in two research courses in the program. The courses include Research methods (SS200) and Directed Study (SS280). The rubric looked at the following criteria: Thesis formulation, reliability of sources, analysis, synthesis, and process. Each category will be worth 4 points. What we found:
Results for all courses that utilized pre and posttest to assess student learning show an increase in scores average score from pretest to post-test. While the average overall score from the courses showed an increase for the post tests, the score is still below the passing score. Detail results of the pretest and posttest on individual courses that utilize the pretest and posttest as assessment tools are depicted in Table 1. Based on experience, division faculty think that there are actors that may have influenced students’ performance on the program assessment result which can be attributed to the following:
Further information and detailed results on students’ performance on the assessment from the selected courses are indicated in Table 1. Table 1 shows results of pre-post tests for AY 2014-2015.
PSLO # 3. Demonstrate proficient knowledge of the structure and functions of the government and social, political, and economic issues concerning the Micronesian Studies course content. Table 2 shows class results on common essay that assessed students’ understanding of major concepts in Micronesian Cultural Studies (SS195), Micronesian Government & Politics (SS205), Economy of Micronesia (SS212), and Contemporary Issues in Micronesia (SS220). Three aspects of performance were assessed as can be seen in Table 2.
Table 2. Students’ Essays Overall results show that students have proficient knowledge on core concepts in the selected courses. However, their level of reasoning and their ability to communicate the issues are the two weak areas. Students were able to identify issues and topics.
PSLO # 4. Demonstrate the ability to perform research and write papers relevant to Micronesia using different methods and technologies. Assessment results in both semesters reveal that Analysis continues to be the weakest area for research papers, while Thesis formulation remains the strongest area. Detailed results of student ratings on the seven areas are stated in Table 3.
Table 3 shows class results for final research papers that assessed 6 different criteria of performance.
The results reported here reflect only the final paper, as dictated by the Micronesian Studies Assessment plan for the SY 2014-2015. Upon submission, the final paper was expected to be written in APA format with a cover page, an Abstract, Introduction, Methodology, Findings and results, Analysis, and a Conclusion and Discussion. Assessment results for both semesters (Fall 2014 & Spring 2015) reveal that Analysis continues to be the weakest for research papers while Thesis formulation remains the strongest area. Another weaker area is the documentation part of the research paper. Here students were able to provide a list or reference, but repeatedly failed to cite evidence in the in-text.
What we are planning to work on:
Recommendations for students:
PSLO Assessment Report Summary (Academic year 2015-2016) What we looked at: PSLO 2 was assessed, using pre and posttests with a scoring rubric, in SS introductory courses. The aim is to assess students’ knowledge on major concepts in the SS courses at the beginning and at the end of a course. The courses assessed include Introduction to Political Science (SS101), Introduction to Geography (SS120), Geography of the Pacific (SS125), and Micronesian Cultural Studies (SS195). PSLO 3 was assessed, using reflective writing which focuses on students’ understanding of specific course concepts. The courses assessed include Micronesia Cultural Studies (SS195), Micronesia Government & Politics (SS205), Economy of Micronesia (SS212) and Contemporary Issues in Micronesia (SS220). The rubric rated 3 categories: knowledge, reasoning, and communication of the core concepts for each course. PSLO 4 was assessed, using final research papers in two research courses in the program. The courses include Research methods (SS200) and Directed Study (SS280). The rubric looked at the following criteria: Thesis formulation, reliability of sources, analysis, synthesis, and process. Each category will be worth 4 points. What we found:
Results for all courses that utilized pre and posttest in assessing student learning outcomes show an increase in average score from pretest to post-test. While the average overall score for the courses showed an increase in the post tests, the score is still below the passing score. Detailed results of the pretest and posttest on individual courses that utilize the pretest and posttest as assessment tools are depicted in Table 1. The division faculty observed the same actors that may have influenced students’ performance on the program assessment result which can be attributed to the following:
Table 1 shows results of pre-post tests for AY 2015-2016.
PSLO # 3. Demonstrate proficient knowledge of the structure and functions of the government and social, political, and economic issues concerning the Micronesian Studies course content. Table 2 shows average class results on common essay that assessed students’ understanding of major concepts in Micronesian Cultural Studies (SS195), Micronesian Government & Politics (SS205), Economy of Micronesia (SS212), and Contemporary Issues in Micronesia (SS220). Three aspects of performances (Knowledge, Reasoning, and communication) were assessed as can be seen in Table 2 below.
Overall results show that students have proficient knowledge on core concepts in the selected courses. However, their level of reasoning and their ability to communicate the issues are the two weak areas. Students were able to identify issues and topics.
PSLO # 4. Demonstrate the ability to perform research and write papers relevant to Micronesia using different methods and technologies.
Table 3 shows class results for final research papers that assessed 6 different criteria of performance.
Results reported here reflect only the final paper results, as dictated by the Micronesian Studies Assessment plan for the SY 2015-2016. Upon submission, the final paper was expected to be written in APA format with a cover page, an Abstract, Introduction, Methodology, Findings and results, Analysis, and a Conclusion and Discussion. Assessment results for both semesters (Fall 2015 & Spring 2016) reveal that Analysis continues to be the weakest area of performance on research papers while Thesis formulation remains the strongest. The results are similar to previous Program Assessment Summary for 2014-2015. Other observations: Table 4 shows the Common Essay Tests that were given during the 9th and 15th week of Spring 2016 SS150 History of Micronesia sections 1&2.
The Common Essay Tests were piloted during Fall 2015 and Spring 2016. For Fall 2015 the students that met the minimum outcome of 70% were at 88% for Part I and 75% for Part II. Part I was on the Spanish colonial periods and German era while Part II was on the Japanese era and American colonial period.
What we are planning to work on:
Recommendations for students:
|
|||||||||||||||||||||||||||||||||||||||||||||||||||||||||||||||||||||||||||||||||||||||||||||||||||||||||||||||||||||||||||||||||||||||||||||||||||||||||||||||||||||||||||||||||||||||||||||||||||
Program enrollment (historical enrollment patterns, student credits by major) |
Enrollment rate for Micronesian Studies Program for the school year 2014-2016. The figures in Table 10 reflect students enrolled in the program from four (4) campuses. Table 10 shows credits by major and campus for Micronesian Studies.
Table 11 enrollment for Micronesian Studies in comparison to 2 other programs. Enrollment in the Micronesian Studies program for the last 3 years.
Enrollment in the Liberal arts program for the last 3 years.
Enrollment in the Marine Science program for the last 3 years.
It can be concluded from Table 11 that the Micronesian Studies Program is efficient at this rate. Although there is a large discrepancy of enrollment figures when compared with two other programs, it should be noted that Micronesian studies just like the other two continues to receive fairly the same rate of new enrollees.
|
||||||||||||||||||||||||||||||||||||||||||||||||||||||||||||||||||||||||||||||||||||||||||||||||||||||||||||||||||||||||||||||||||||||||||||||||||||||||||||||||||||||||||||||||||||||||||||||||||||||||||||||||||||||||||||||||||||||||||||||||||||||||||||||||||||||||||||||||||||||||||||||||||||||||||||||||||||||||||||||||||||||||||||
Average class size |
Table 12 shows average class size for Program courses.
|
||||||||||||||||||||||||||||||||||||||||||||||||||||||||||||||||||||||||||||||||||||||||||||||||||||||||||||||||||||||||||||||||||||||||||||||||||||||||||||||||||||||||||||||||||||||||||||||||||||||||||||||||||||||||||||||||||||||||||||||||||||||||||||||||||||||||||||||||||||||||||||||||||||||||||||||||||||||||||||||||||||||||||||
Course completion rate |
Table 13 Course completion for Fall 2014
Table 14 Course completion for Spring 2015
Table 15 Course completion for Fall 2015
Table16 course completion rate Spring 2016
It is important to note that given the enrollment in each program course; more than 70% of the students have completed the course with a grade of C (70%) or better, within the last two years. It should also be mentioned that in consecutive semesters, Fall2015& Spring2016, passing rate for SS200 Research methods was below 70%. This is also reflected in the program level assessment, expressing students’ weak performance in critical thinking or analysis, which is a major part of this course.
|
||||||||||||||||||||||||||||||||||||||||||||||||||||||||||||||||||||||||||||||||||||||||||||||||||||||||||||||||||||||||||||||||||||||||||||||||||||||||||||||||||||||||||||||||||||||||||||||||||||||||||||||||||||||||||||||||||||||||||||||||||||||||||||||||||||||||||||||||||||||||||||||||||||||||||||||||||||||||||||||||||||||||||||
Student retention rate (Fall-to-Fall for two-year programs; Fall-to-Spring for one-year programs) |
Table 18 indicates retention rate for the Micronesian Studies Program for semesters indicated below.
Micronesian in comparison to one AS degree program (Marine Science) and one AA degree program (Liberal arts).
As can be seen with two other programs (table above), although enrollees into the program is smaller compared to Marine Science (21retained 76.20%) and Liberal Arts (51retained 68.62%), Micronesian studies retained 93.33% of its 15 students. |
||||||||||||||||||||||||||||||||||||||||||||||||||||||||||||||||||||||||||||||||||||||||||||||||||||||||||||||||||||||||||||||||||||||||||||||||||||||||||||||||||||||||||||||||||||||||||||||||||||||||||||||||||||||||||||||||||||||||||||||||||||||||||||||||||||||||||||||||||||||||||||||||||||||||||||||||||||||||||||||||||||||||||||
Student persistence rate (semester to semester) |
Table 19 indicates persistence from semester to semester.
Persistence for the students in the program is more than 630 based on this report. However, there is need to see the latest trend on this area. Notice that no recent data is available for this. Data received from IRPO. |
||||||||||||||||||||||||||||||||||||||||||||||||||||||||||||||||||||||||||||||||||||||||||||||||||||||||||||||||||||||||||||||||||||||||||||||||||||||||||||||||||||||||||||||||||||||||||||||||||||||||||||||||||||||||||||||||||||||||||||||||||||||||||||||||||||||||||||||||||||||||||||||||||||||||||||||||||||||||||||||||||||||||||||
Success rates on licensing or certification exams (CTE, TP, Nursing, etc) |
None |
||||||||||||||||||||||||||||||||||||||||||||||||||||||||||||||||||||||||||||||||||||||||||||||||||||||||||||||||||||||||||||||||||||||||||||||||||||||||||||||||||||||||||||||||||||||||||||||||||||||||||||||||||||||||||||||||||||||||||||||||||||||||||||||||||||||||||||||||||||||||||||||||||||||||||||||||||||||||||||||||||||||||||||
Graduation rate based on yearly number |
Table 20 reflects data on recent report provided from the Office of Admissions and Records.
Figures are optimistic as they are parallel to the number of students who enroll into the program each academic year. Data show that each year, the program receives around 25-30 students. Analogous to that is the number of students who graduate each academic year from the program, as can be seen in Table 20. Thus, one can conclude that the program is sustaining at this rate. |
||||||||||||||||||||||||||||||||||||||||||||||||||||||||||||||||||||||||||||||||||||||||||||||||||||||||||||||||||||||||||||||||||||||||||||||||||||||||||||||||||||||||||||||||||||||||||||||||||||||||||||||||||||||||||||||||||||||||||||||||||||||||||||||||||||||||||||||||||||||||||||||||||||||||||||||||||||||||||||||||||||||||||||
Students seat cost |
None |
||||||||||||||||||||||||||||||||||||||||||||||||||||||||||||||||||||||||||||||||||||||||||||||||||||||||||||||||||||||||||||||||||||||||||||||||||||||||||||||||||||||||||||||||||||||||||||||||||||||||||||||||||||||||||||||||||||||||||||||||||||||||||||||||||||||||||||||||||||||||||||||||||||||||||||||||||||||||||||||||||||||||||||
Cost of duplicate or redundant courses, programs or services |
None |
||||||||||||||||||||||||||||||||||||||||||||||||||||||||||||||||||||||||||||||||||||||||||||||||||||||||||||||||||||||||||||||||||||||||||||||||||||||||||||||||||||||||||||||||||||||||||||||||||||||||||||||||||||||||||||||||||||||||||||||||||||||||||||||||||||||||||||||||||||||||||||||||||||||||||||||||||||||||||||||||||||||||||||
Revenue generated by program – tuition (program allocated), grant income. |
The revenue generated here does not include other social science courses taught at the national courses. The revenue is calculated based total credits times cost per credit ($105). The figures above do not include cost generated by other social science courses which are offered as requirements and/or electives for other degree programs at the college. |
||||||||||||||||||||||||||||||||||||||||||||||||||||||||||||||||||||||||||||||||||||||||||||||||||||||||||||||||||||||||||||||||||||||||||||||||||||||||||||||||||||||||||||||||||||||||||||||||||||||||||||||||||||||||||||||||||||||||||||||||||||||||||||||||||||||||||||||||||||||||||||||||||||||||||||||||||||||||||||||||||||||||||||
Students’ satisfaction rate |
Of the 43 students who were given Micronesian studies exit survey, 95% agree that the program has been helpful in meeting their expectations. Another 93% agrees that the program has been helpful in contributing to new knowledge that relates to research, politics, history, and the issues in Micronesia. It is also interesting to note that 61% of the students were not satisfied with the availability of advisors. Reasons may be many but one implication of this is that the program needs another faculty, given the many students who take Social science courses as requirements and/or electives. The data reported here are compiled from exit surveys given to SS280 class towards the end of each semester. |
||||||||||||||||||||||||||||||||||||||||||||||||||||||||||||||||||||||||||||||||||||||||||||||||||||||||||||||||||||||||||||||||||||||||||||||||||||||||||||||||||||||||||||||||||||||||||||||||||||||||||||||||||||||||||||||||||||||||||||||||||||||||||||||||||||||||||||||||||||||||||||||||||||||||||||||||||||||||||||||||||||||||||||
Alumni data |
The faculty in the program could only track a certain number of students who have graduated from the program. The data here are reported with the understanding that the tools may not be reliable. However, they are the only existing mechanisms for tracking the students. The data are retrieved from email communications, group network on facebook, an exit survey administered to students in the program in their final semester at the College, and communication via linked-in connection between faculty and several alumni of the program. The figure reflects students who have transfer rate for Micronesian studies alumni. Table 22 indicates rate of transfer into other programs at COM-FSM, higher education institutions abroad, and into the labor market.
Of the 60 students (see Table 20) who graduated from the program between Fall2014-Spring 2016, 42 (70%)) have transferred. The fact that 70% of the students who graduated from the program transferred is indicative of the program’s success. It should be stated that figures may be higher because the remaining number of graduates is unaccounted for. This once again raises the need for this institution to have a systematic tracking tool. |
||||||||||||||||||||||||||||||||||||||||||||||||||||||||||||||||||||||||||||||||||||||||||||||||||||||||||||||||||||||||||||||||||||||||||||||||||||||||||||||||||||||||||||||||||||||||||||||||||||||||||||||||||||||||||||||||||||||||||||||||||||||||||||||||||||||||||||||||||||||||||||||||||||||||||||||||||||||||||||||||||||||||||||
Employment data and employer feedback (employer survey) |
NA |
||||||||||||||||||||||||||||||||||||||||||||||||||||||||||||||||||||||||||||||||||||||||||||||||||||||||||||||||||||||||||||||||||||||||||||||||||||||||||||||||||||||||||||||||||||||||||||||||||||||||||||||||||||||||||||||||||||||||||||||||||||||||||||||||||||||||||||||||||||||||||||||||||||||||||||||||||||||||||||||||||||||||||||
Program added or cancelled at nearby regional institutions (PCC, GCC, Hawaii schools, UOG, CMI, NMC) |
NA |
||||||||||||||||||||||||||||||||||||||||||||||||||||||||||||||||||||||||||||||||||||||||||||||||||||||||||||||||||||||||||||||||||||||||||||||||||||||||||||||||||||||||||||||||||||||||||||||||||||||||||||||||||||||||||||||||||||||||||||||||||||||||||||||||||||||||||||||||||||||||||||||||||||||||||||||||||||||||||||||||||||||||||||
Transfer rate |
Table 23 indicates rate of transfer to other programs at COM-FSM, higher education institutions, and the labor market.
|
||||||||||||||||||||||||||||||||||||||||||||||||||||||||||||||||||||||||||||||||||||||||||||||||||||||||||||||||||||||||||||||||||||||||||||||||||||||||||||||||||||||||||||||||||||||||||||||||||||||||||||||||||||||||||||||||||||||||||||||||||||||||||||||||||||||||||||||||||||||||||||||||||||||||||||||||||||||||||||||||||||||||||||
Analysis |
|||||||||||||||||||||||||||||||||||||||||||||||||||||||||||||||||||||||||||||||||||||||||||||||||||||||||||||||||||||||||||||||||||||||||||||||||||||||||||||||||||||||||||||||||||||||||||||||||||||||||||||||||||||||||||||||||||||||||||||||||||||||||||||||||||||||||||||||||||||||||||||||||||||||||||||||||||||||||||||||||||||||||||||
Findings |
|
||||||||||||||||||||||||||||||||||||||||||||||||||||||||||||||||||||||||||||||||||||||||||||||||||||||||||||||||||||||||||||||||||||||||||||||||||||||||||||||||||||||||||||||||||||||||||||||||||||||||||||||||||||||||||||||||||||||||||||||||||||||||||||||||||||||||||||||||||||||||||||||||||||||||||||||||||||||||||||||||||||||||||||
Recommendations |
|
||||||||||||||||||||||||||||||||||||||||||||||||||||||||||||||||||||||||||||||||||||||||||||||||||||||||||||||||||||||||||||||||||||||||||||||||||||||||||||||||||||||||||||||||||||||||||||||||||||||||||||||||||||||||||||||||||||||||||||||||||||||||||||||||||||||||||||||||||||||||||||||||||||||||||||||||||||||||||||||||||||||||||||
Form is newly revised. Previous Program Reviews are available at
http://wiki.comfsm.fm/Academic_Programs
Micronesian Studies is a very good example. Program review checklist is on the next page.
This website and all COM-FSM Internet based services are best viewed with Firefox 3.0 or better.
© Copyright 2026 College of Micronesia-FSM | Site Disclaimer
P. O. Box 159, Kolonia, Pohnpei, 96941 - (691) 320-2480
College of Micronesia-FSM is accredited by the Accrediting Commission for Community and Junior Colleges,
Western Association of Schools and Colleges, 428 J Street., Suite 400 Sacramento, CA 95814, (415) 506-0234,
an institutional accrediting body recognized by the Council for Higher Education Accreditation and the U.S. Department of Education.
Additional information about accreditation, including the filing of complaints against member institutions, can be found at: www.accjc.org