- Our College
- Academics
- Student Services
- Public Reports
- Forum
- Library
- Quick Access
At the completion of Business Administration Program, the student will be able to:
PSLO Assessment Report Summary
During assessment cycle 2014-2015, the Business Administration Program assessed PSLO 1, 3, and 5. The Division used a collaborative assessment activity to measure student’s basic knowledge in the fundamental areas of business. In early January the faculty met with the students to discuss the results of the program assessment results to the students and to inform the students of the improvements plans for coming semester.
In addition to PSLO 1, we also assessed PSLO 2, and PSLO 4.
The collaborative activity used to assess PLSO 1 required students to perform the skills they learned from management, marketing, economics, finance, and accounting. Although several courses joined the collaborative activity, data used to assess the said PSLO came from the BU250 students. The success of the collaboration between the students emphasized the importance of each course in the organization and how their interrelationship is important in the achieving the organization’s objectives.
To assess PSLO 2, we used the assessment results of AC250_CSLO_2 (F4), using the group project that demonstrates basic knowledge and skill in determining and accounting for product costs.
The assessment of PSLO 4 will be done thru the assessment of the class' final Business Plan as it is a summative assessment for the class and allows the Professor to look at their abilities to write and speak (there is a presentation component to this unit) while presenting an idea for a business that would be feasible in their communities and cultures (hence assessing their intercultural sensitivities, etc.).
PSLO 1
BUA_PSLO_1 ASSESSMENT RUBRIC |
||||
Fundamental Skills |
Did not meet expectations (69% and below) |
Met expectations (70% - 89%) |
Exceeded expectations (90%100%) |
Total |
Finance |
50% |
50% |
|
100% |
Managment |
|
50% |
50% |
100% |
Marketing |
|
50% |
50% |
100% |
Accounting |
50% |
25% |
25% |
100% |
Econimics |
|
75%% |
25% |
100% |
The results of the rubrics show that among the fundamental areas of business for which they were assessed, two courses have percentages of students who did meet the expectation.
The results show that out of the different skills they were assessed there were two skills that showed students not meeting expectations. Fifty percent of the students assessed did not meet expectations for demonstrating their skills in finance. These students had difficulty projecting costs and revenues, which resulted to their low rating on the rubric. Some of the groups did not identify all their costs, which affected their projected cash flows. Two of the four, or 50%, of the groups who turned in their financial statements, records, and source documents, either met or exceeded expectations, while the remaining half failed to meet expectations for he accounting component of PSLO 1. It is important to note that the results applied only to groups, and not to individual students, since the latter’s performance would depend on how actively they participated in their respective group’s activities.
Students assessed for their accounting skills showed that reports, records and documents from groups that failed to meet expectations showed indications of rushed job, lack or absence of proofreading, and appeared to have been done by one or two individuals rather than by the whole group. Almost all participating students had taken Accounting II under the same instructor in prior semester(s). Many performed satisfactorily while in that class, but during the F4 event, some failed to adequately demonstrate previously acquired accounting knowledge and/or skills in actual practice. All four groups made similar errors in recording and reporting transactions involving owners’ capital contribution. Instead of crediting Capital (or Common) Stock, they used individual owner’s capital account, as if their businesses were organized as partnerships and not as corporations.
The collaborative activity also showed that when students were asked to make their business plan, they had a slight problem in the quality of description and analysis. Although students have good ideas, the description of these is not extensive and is not that quality that will be appropriate in real-life scenarios. In addition, the problem analysis is not also very clear and specific.
PSLO 2
|
Areas of Assessment |
Did not Meet |
Met |
Exceeded |
|
|
Expectations |
Expectations |
Expectations |
|
|
(below 70% |
(70-89% |
(90-100% |
|
|
correct) |
correct) |
correct) |
I. Accuracy of Journal Entries for |
|
|
|
|
Manufacturing Transactions in accordance |
|
|
|
|
with the Generally Accepted Accounting |
|
|
|
|
Principles (GAAP): |
|
|
|
|
1. |
Purchase of Materials |
0.00% |
0.00% |
100.00% |
2. |
Issuance of Materials |
0.00% |
40.00% |
60.00% |
3. Incurrence of Direct Labor and |
0.00% |
20.00% |
80.00% |
|
|
Overhead Costs |
|
|
|
4. |
Transfer to Finished Goods |
|
100.00% |
0.00% |
|
|
|
||
|
|
|
|
|
II. Appropriateness of the presentation of the |
0.00% |
|
100.00% |
|
Cost of Goods Manufactured and Sold Section |
|
|
|
|
of the Income Statement in accordance with |
|
|
|
|
the GAAP. |
|
|
|
|
AVERAGE FOR THIS COURSE |
0.00% |
32.00% |
68.00% |
|
III. Correctness and compliance with the |
|
|
|
|
GAAP of the following Miscellaneous Areas |
|
|
|
|
Combined: |
|
|
|
|
1. Journal entries for other transactions |
0.00% |
100.00% |
0.00% |
|
2. Other sections of the Income Statement |
0.00% |
0.00% |
100.00% |
|
3. Balance Sheet |
0.00% |
100.00% |
0.00% |
|
|
|
|
|
|
AVERAGE FOR PREVIOUS ACCTG COURSES |
0.00% |
66.67% |
33.33% |
|
|
|
|
|
|
The results show that group activities and collaborative learning enabled students to analyze, and evaluate accounting information better. The weaknesses of students were on their skills on filling out forms: Most students tend to forget to make more forms for any additions (like, additional employees). In addition, most students get stuck when information is not readily available, like compensations by contract. Even when they are instructed how to do it, they still need to get a graphic illustration on how to fill these out.
PLSO 4
EN/BU 121: Business Communication
During the 2015-2016 School Year, students in the Business Communication classes were required to write business letters, business proposals and a business plan that needed to follow the typical Business Communication Writing conventions as used in a Western Society (America, British, Australian, etc) but to take into context the more culturally diverse society that they are living in and also the culturally diverse backgrounds of the people who may be reading their letters, their proposals and their business plans. When working on these writing activities, students were required to consider the fact that recipients may not always use Western Society writing conventions and may also not hold views similar to people from a Western society so they needed to adapt their writing so that it may be culturally sensitive to the recipients.
There were 27 students enrolled in the Business Communication class during the Fall 2015, and 25 students during the Spring 2016 semester making up a total of 52 students overall. All of the students in the class were required to submit business letters, business proposals and a business plan by the end of the semester. Among the many areas that were assessed on the business plan, one of the areas that was assessed when evaluating these writing activities covered the PSLO #4 for the Business Program which states that students will be able to “demonstrate basic knowledge and skill in intercultural writing and speaking appropriate for business.” When assessing their business plans, during the 2015-2016 period, here is what we found with regards to PSLO #4: (A rubric is attached for the Business plan evaluations)
Semester |
# of students achieving the PSLO |
| Fall 2015 | 10 students out of 20 (50% of the students who did the plan) were able to demonstrate Mastery of cultural sensitivity and feasibility in their business plan. Mastery in this class meant achieving at least a 80% or higher (16 points on a scale of 20 points) on the intercultural writing and speaking component on the grading rubric. 5 students (25%) demonstrated that they were still in the developing level of mastery since they were able to demonstrate cultural awareness and knowledge in most areas of their plan but not all. Developing meant that they achieved between 70-75% or scored between 14-15 points on a scale of 20 points on the grading rubric. 5 students (25%) demonstrated that they were still in the beginning level of mastery since they were able to demonstrate cultural awareness and knowledge in a few areas of their plan but not all. Beginning meant that they achieved between 60-65% or scored between 12-13 points on a scale of 20 points on the grading rubric. 4 students did not do any of the work on the business plan and so no evidence was available to assess their abilities on this PSLO. *NOTE: Note that the final presentations reflected what was in their business plans so the outcomes are somewhat similar to the business plan results. |
Spring 2016 |
12 Students out of 20 (60% of the students who did the business plan) were able to demonstrate Mastery of cultural sensitivity and feasibility in their business plan. Mastery in this class meant achieving at least a 80% or higher (16 points on a scale of 20 points) on the grading rubric. 5 students (or 25% of the 20 students) demonstrated that they were still in the developing level of mastery since they were able to demonstrate cultural awareness and knowledge in most areas of their plan but not all. Developing meant that they achieved between 70-75% or scored between 14-15 points on a scale of 20 points on the grading rubric. 3 students (or 15% of the 20 students) demonstrated that they were still in the beginning level of mastery since they were able to demonstrate some cultural awareness and knowledge in a few areas of their plan but not all. Beginning or introductory meant that they achieved between 60-65% or scored between 12-13 points on a scale of 20 points on the grading rubric. 5 students did not do any of the work on the business plan and so no evidence was available to assess their abilities on this PSLO |
PSLO 1
PSLO 2
PSLO 4
|
AP Full Official |
A.S. Business Administration |
||
|
Campus |
National Campus |
AP Review Submission Date |
September 22, 2016 |
|
Completed by |
Business Division Faculty |
AR Review Cycle |
fall 2014 – spring 2016 |
|
Program Mission |
|||
|
Development of the private sector as key to promoting national economic self-sufficiency/selfreliance is one of the goals of the College of Micronesia-FSM. The A.S. in Business Administration (BUA) program addresses this goal by offering courses designed to:
|
|||
|
Program Goals |
|||
| Program goals are broad statements concerning knowledge, skills, or values that the faculty members expect the graduating students to achieve. | |||
|
The student will be able to demonstrate basic knowledge and/or skills in:
|
|||
|
Program History |
|||
The Associate of Science degree in Business Administration was added to COM-FSM’s offering in 1974 and the Associate of Science degree in Accounting in 1989. The programs were run side by side and were constantly updated to reflect changes in the job market and in academia. In 2002, upon recommendation by the Business Programs Advisory Council, accounting and business merged into one program – the Associate of Science in Business Administration. The program learning outcomes (above) were adopted in Spring 2004. As a result of a program evaluation made in February 2009, the program was modified, reducing the Program Learning Outcomes (PLOs) from nine to five, and increasing the graduation requirements from 68 to 70 credits. The changes were implemented in Fall 2010. The Young Executives Society (YES!) was formed in March 2012. Among its purposes are: 'To promote business administration programs at the College of Micronesia-FSM to four year level to enable students to earn bachelor's degree in business administration,' and, 'To promote COM- FSM as the recruiting ground for public and private sector employers interested in the recruitment of students who successfully completed their studies in the field of business administration.' In order to promote partnership between local businesses/employers and the college, and in line with its goal to establish a services network for community, workforce, and economic development, the new Business Advisory Council convened in Kolonia in October 2012 thru the initiative of the Business Administration Division. In fall 2014, the program faculty launched the Friday the Fourteenth Food Festival (F4), a collaborative project by faculty and students from selected program courses. Relaunched in spring 2015 as “F4 is Back” with the acronym taking on new meaning (Food & Fashion Friday Festival), its purposes were to (1) foster integration among program major courses through synchronized, complementary, and collaborative projects in order to improve the overall student learning experience, and (2) use the resulting information from the projects as material for authentic program assessment. The fall 2015 edition of the F4 saw the involvement of the Center for Entrepreneurship, which gave cash awards to the best performing groups. In spring 2015, the Business Administration Division conducted an online alumni survey for its four programs. Feedback received (included in this report) from respondents who completed the A.S. Business Administration program, showed a need for the college to offer four-year or bachelor’s degree program in both Business and Accounting. |
|||
|
Program Description |
|||
|
The program description describes the program, including its organization, relationship to other programs in the system, program design, degree(s) offered, and other significant features of the program, such as elements/resources for forward-looking new program contributions to the state’s economy, or specialized program accreditation. |
|||
|
Organization: Program Design and relationship to other programs in the system: |
|||
|
Program Admission Requirements |
|||
|
This section describes the requirements for admission into the program and other requisites. |
|||
|
Applicants must meet the following admission requirements to be matriculated into this degree program:
|
|||
| Program Certificate/Degree Requirements |
| This section specifies the requirements for obtaining a certificate/degree in the program, including specific courses, sequencing of courses, total credits, internships, practical, etc. |
|
An Associate Degree in Business Administration is awarded upon satisfactory completion of the 29 credits of applicable General Education Core and 41 credits of the major courses, for a total of 70 credits. Before enrolling in any given course or advancing to the next-level course, students must first complete the corresponding prerequisite(s). The program's major courses, their brief descriptions and prerequisites are given below. AC 131 Accounting I This course establishes a foundation for the understanding of the nature of accounting, basic accounting concepts and principles, and the complete accounting cycle for service and merchandising types of business operation. Extensive coverage is devoted to the use of various accounting forms and the performance of basic accounting functions including, but not limited to, recording and posting business transactions, preparing a trial balance, work sheet, and simple financial statements. The importance of internal control for cash, preparing bank reconciliation, and performing limited analysis of basic financial reports are also included. AC 220 Accounting II This course builds on the understanding of accounting principles and introduces new concepts in accounting for: payroll; accounts receivable and bad debts; notes and interest; inventory; depreciation, amortization and depletion of long-term assets; partnerships and corporations. AC 250 Managerial Accounting This course develops concepts and potential ethical issues related to the accounting information that managers need in carrying out three essential functions within the business enterprise, such as how to plan operations, to control activities and to make decisions. BU 101 Introduction to Business Establishes a foundation for the understanding of contemporary business functional areas of business: management and organization, human resources, marketing, financing, accounting, and information systems. Business ethics and social responsibility, the global business environment and basic FSM business laws/ regulations are also covered. BU 250 Principles of Finance This course provides an introduction to the role and objective of financial management with focus on shareholder wealth maximization, examines both analytical tools and descriptive materials that are useful in the evaluation of financial performance, and explores the domestic and international financial marketplace, the time value of money, analysis of risk and return, capital budgeting and cash flow analysis. BU 260 Fundamentals of Management Enables the students to develop an understanding of management and organization. The course focuses on important management functions such as planning, organizing, leading, and controlling for successful managerial activities. Students learn how successful managers use organizational resources through organizational functions in order to effectively and efficiently achieve organizational objectives. BU 270 Principles of Marketing Introduces students to the basic concepts of marketing such as consumer behavior, marketing research and information systems, segmentation strategy, as well as the 4Ps. Students are also introduced to international marketing and to the broader marketing environment, including political/legal, economic, demographic, competitive and ethical issues. BU 271 Business Law Introduces the FSM and the US legal system as it relates to contracts, agency and employment, property, sales, business organization and government regulation. Students are provided an overview of the FSM Constitution and the basic principles of court organization, and a survey of tort law as applied to both the FSM and the US. BU/MS 110 Business Math Emphasizes performing common computations found in the various functional areas of business. Students use of graphs, equations, ratio and proportion, percentage, and measurement systems to solve typical business problems such as the calculation of trade and cash discounts, markups, taxes, employee compensation, simple and compound interest, depreciation, inventory valuation, bonds and stocks, basic financial statement analysis, and business statistics. EC 220 Principles of Microeconomics This course provides an introduction to the central concepts of microeconomic analysis and decision-making, such as scarcity, allocation of resources, demand and supply, elasticity and marginal utility. The concepts are then used to explain and analyze market structures, including perfect competition and monopoly. Other topics may include analysis of labor markets, property rights and international economic. EC 230 Macroeconomics This introductory course in macroeconomics analyzes the aggregate economic activity in the national economy and its link with the rest of the world. Emphasis is placed on basic principles involved in the determination of the level of national output, the aggregate price level, money supply, exchange rate, employment and unemployment, inflation, fiscal and the monetary policies. It further provides a broad understanding of economic growth and its implications on the economy. EN/BU 121 Business Communication This course focuses on introducing students to writing and speaking skills appropriate for business. Business writing and oral skills are emphasized, including internal and external business correspondence, employment correspondence, business etiquette, interviewing skills, presentation-giving, intercultural communication and verbal/non-verbal communication. It also focuses on “intercultural writing and speaking appropriate for business”. MS 150 Introduction to Statistics A one semester course designed as an introduction to the basic ideas of data presentation, descriptive statistics, linear regression, and inferential statistics including confidence intervals and hypothesis testing. Basic concepts are studied using applications from health, education, business, social science, and the natural sciences. The course uses spreadsheet software for both data analysis and presentation. |
| Program Courses and Enrollment |
|
This section lists courses offered in the program, including number of sections, course enrollment, section fill rates, and redundancy of courses across the institution. |
Enrollment by program courses for 2014-2016 are not available as of this writing. The semester-by-semester program enrollment for the period are shown in Table-1 (right) and Chart-1 (below). Chart-1: Number and Relative size of Program Enrollment for 2014-2016/ source:IRPO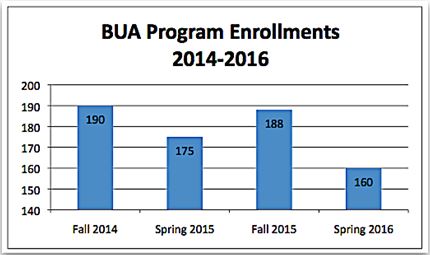 Table-1: Number of Program Enrollment for 2014-2016/ source:IRPO 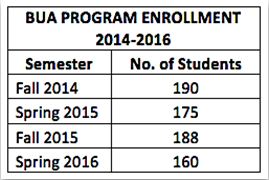 |
| Program Faculty |
|
This section reports the faculty of the program, including full-time and part-time faculty. The degrees held and rank are provided for the full-time and part-time faculty. Finally, provide the faculty student ratio for the program. |
The Business Administration Division (BAD) is chaired by Mr. Joseph Felix, Jr. Four full-time instructors from the division (next page) teach the major program courses as of Spring 2016 BAD Faculty: Front, left to right= Marlene Mangonon, and Marian Gratia Medalla  Division Chair: Full-time Program Instructors: Rafael Pulmano, CPA Marian Medalla, CPA George Mangonon Timothy Mamangon |
|
Program Indicators |
|
This section provides the data for analyzing the extent to which the program has achieved the established outcomes and criteria. This is the most important part of the program review. The data that will be collected and evaluated are the following: |
| Program Enrollment |
Enrollment TABLE-2. NUMBER OF ENROLLMENT FOR LEADING PROGRAMS FALL 2014-SPRING 2016 SOURCE: IRPO 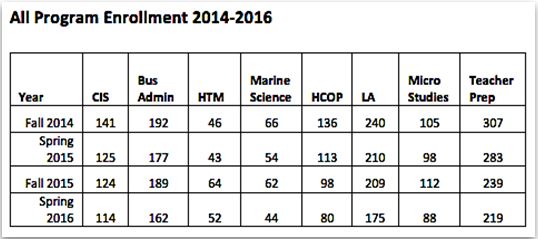 CHART-2. NUMBER AND RELATIVE SIZE OF ENROLLMENT FOR LEADING PROGRAMS, FALL 2014-SPRING 2016 SOURCE: IRPO 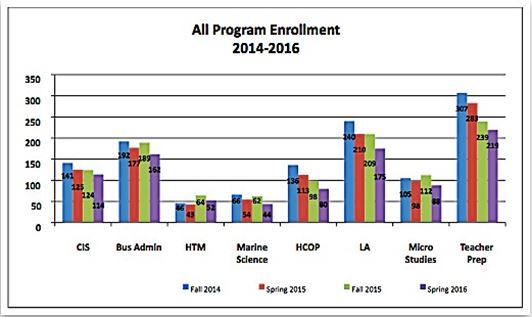 Table-2 and Chart-2 indicate that the A.S. in Business Administration program consistently ranks third among the leading programs in terms of enrollment for fall 2014-spring 2016. Teacher Prep leads in enrollment performance, followed by Liberal Arts. Trends Data in the table and charts on next page show the enrollment trend from fall2012 to spring 2016, revealing an average decline of 5%, which is less than the overall average of 6%. TABLE-3. ENROLLMENT TREND FOR LEADING PROGRAMS, FALL 2012-SPRING 2016 SOURCE: IRPO 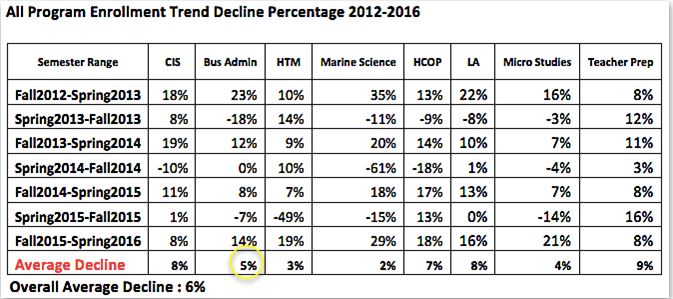 CHART-3. AVERAGE DECLINE IN ENROLLMENT FOR LEADING PROGRAMS, FALL 2012-SPRING 2016 SOURCE: IRPO 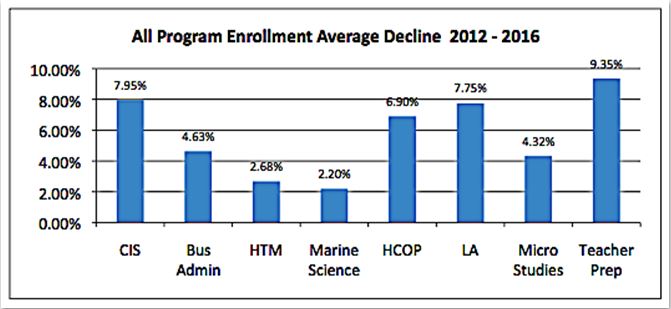 CHART-4. TREND IN ENROLLMENT FOR LEADING PROGRAMS, FALL 2012-SPRING 2016 / SOURCE: IRPO 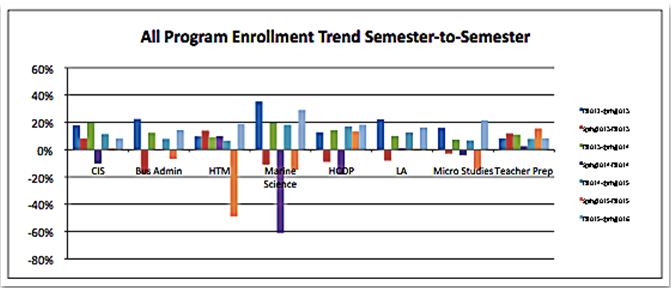 CHART-5. DECLINING ENROLLMENT TREND FOR LEADING PROGRAMS, FALL 2012-SPRING 2016 SOURCE: IRPO 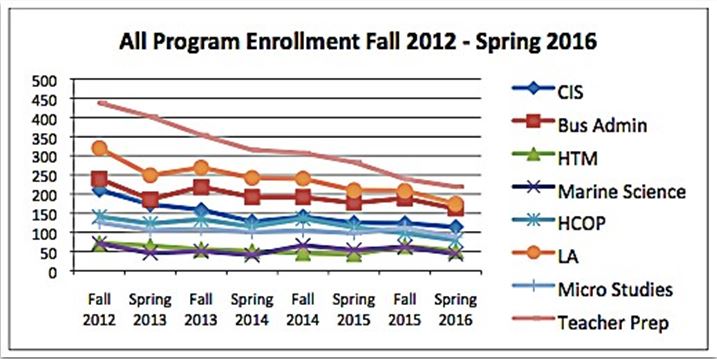 Credits Program enrollment by credits, both by BUA and in comparison with other leading programs, are presented next. For the program, there was a slight decrease in the number of credits enrolled from fall to fall, or a difference of 2 credits. But from spring to spring, the decline was significant (235 credits). TABLE-4. PROGRAM ENROLLMENT CREDITS, FALL 2014-SPRING 2016 SOURCE:IRPO 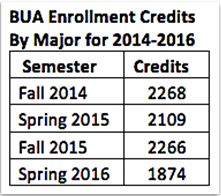 CHART-6. BUA ENROLLMENT SIZE BY CREDITS, FALL 2014-SPRING 2016 / SOURCE: IRPO 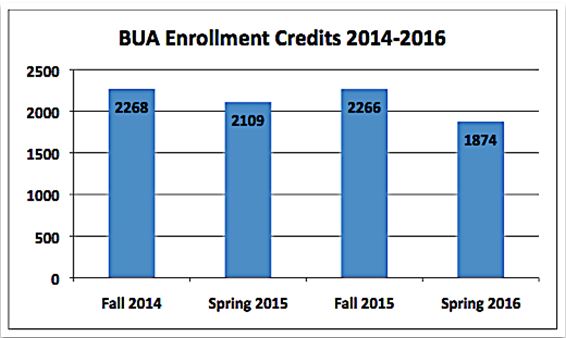 TABLE-5. ENROLLMENT CREDITS FOR LEADING PROGRAMS, SPRING 2015-2016 SOURCE: IRPO 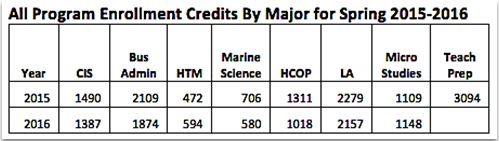 CHART-7. ENROLLMENT SIZE BY CREDITS FOR LEADING PROGRAMS, SPRING 2015-2016 SOURCE: IRPO 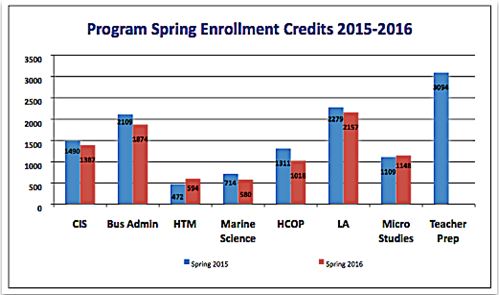 TABLE-6 . ENROLLMENT CREDITS BY MAJOR, FALL 2014-2015 SOURCE:IRPO CHART-8. ENROLLMENT SIZE BY CREDITS ACCORDING TO MAJOR, FALL 2014-2015 SOURCE: IRPO |
| Average class size |
Class Size The average class size per semester for the BUA program is presented next, along with similar indicator for other leading programs. For this program, spring 2016 showed the highest average class size (22.6), although enrollment during that period was actually the lowest for the program compared to the previous three (see Table 1 and Chart 1). TABLE-7. BUA AVERAGE CLASS SIZE, FALL 2014-SPRING 2016 SOURCE: IRPO CHART-9. BUA AVERAGE CLASS SIZE, FALL 2014-SPRING 2016 SOURCE: IRPO Compared with other leading programs, BUA had the largest class size in spring 2016. In spring 2015 it had the second largest class size, next to LA program (Table-8 and Chart 10). TABLE-8. AVERAGE CLASS SIZE OF LEADING PROGRAMS, SPRING 2015-2016 SOURCE: IRPO CHART-10. AVERAGE CLASS SIZE OF LEADING PROGRAMS, SPRING 2015-2016 SOURCE: IRPO In both fall 2014 and fall 2015, a comparison of leading programs showed that BUA had the largest class size, followed closely by LA TABLE-9. AVERAGE CLASS SIZE OF LEADING PROGRAMS, FALL 2014-2015 SOURCE: IRPO CHART-11. AVERAGE CLASS SIZE OF LEADING PROGRAMS, FALL 2014-2015 / SOURCE: IRPO |
| Course completion rate |
Completion BUA Completion rates for fall 2014 and 2015 were both higher compared to those of spring 2015 and 2016. Between the two semesters, however, fall completion rates were consistently higher that those of spring in both years (Table-10 and Chart-12). TABLE-10. BUA COMPLETION RATE (ABC OR P%), FALL 2014-SPRING 2015 SOURCE: IRPO CHART-12. BUA COMPLETION RATE (ABC OR P%), FALL 2014-SPRING 2015 SOURCE: IRPO TABLE-11. COMPLETION RATE (ABC OR P%) BY MAJOR, SPRING 2015-2016 SOURCE: IRPO CHART-13. COMPLETION RATE (ABC OR P%) BY MAJOR, SPRING 2015-2016 SOURCE: IRPO TABLE-12. COMPLETION RATE (ABC OR P%) BY MAJOR, FALL 2014-2015 SOURCE: IRPO CHART-14. COMPLETION RATE (ABC OR P%) BY MAJOR, FALL 2014-2015 SOURCE: IRPO TABLE-13. COMPLETION RATE (ABC OR P%) BY MAJOR, FALL 2014-2015 SOURCE: IRPO CHART-15. COMPLETION RATE (ABC OR P%) BY MAJOR, FALL 2015-2016 SOURCE: IRPO |
| Student persistence and retention rate (semester to semester) |
Persistence The program’s persistence rates for two consecutive academic years are shown below. From the data in the table and the chart, persistence rate in 2014-2015 is significantly higher at 105% compared to that of 2015-2016 which only reached 68% (Table-14 and Chart-16). TABLE-14. BUA PERSISTENCE RATES FOR 2014-2015 AND 2015-2016 SOURCE: IRPO CHART-16. BUA PERSISTENCE RATES FOR 2014-2015 AND 2015-2016 SOURCE: IRPO Compared with other leading programs, BUA ranked third highest in terms of persistence rate for 2014-2015. HCOP led with 123%, followed by COS with 117%. For the period 2015-2016, persistence rate for BUA dropped to second to last spot, trailing right behind HCOP which, in the previous period, ranked first. Instead, Teacher Prep took the lead with 119%, followed by LA with 111% (Table-15 and Chart-17). TABLE-15. PERSISTENCE RATES OF LEADING PROGRAMS FOR 2014-2015 AND 2015-2016 / SOURCE: IRPO CHART-17. PERSISTENCE RATES OF LEADING PROGRAMS FOR 2014-2015 AND 2015-2016 / SOURCE: IRPO Retention We now look at the retention rates of the leading programs and see how BUA’s performance compared them. Table-16 and Chart-18 show Teacher Prep with the highest retention rate (119%), followed by LA (111%), and BUA(105%) is third, for 2014-2015. TABLE-16. RETENTION RATES OF LEADING PROGRAMS FOR 2014-2015 / SOURCE: IRPO CHART-18. RETENTION RATES OF LEADING PROGRAMS FOR 2014-2015 / SOURCE: IRPO |
| Graduation rate based on yearly number |
Graduation Reviewed in this section are the graduation rates for the BUA program, by itself and in comparison with other leading programs. Table-17 and Chart-19 (next page) show a trend indicating that it was taking longer for many students to graduate from the program. TABLE-17. BUA GRADUATION RATE FALL 2011 TO FALL 2013 SOURCE: IRPO CHART-19. BUA GRADUATION RATE FALL 2011 TO FALL 2013 SOURCE: IRPO TABLE-18. GRADUATION RATES (100%) OF LEADING PROGRAMS FALL 2011 TO FALL 2013 SOURCE: IRPO CHART-20. GRADUATION RATES (100%) OF LEADING PROGRAMS FALL 2011 TO FALL 2013 SOURCE: IRPO TABLE-19. GRADUATION RATES (150%) OF LEADING PROGRAMS FALL 2011 TO FALL 2013 SOURCE: IRPO CHART-21. GRADUATION RATES (150%) OF LEADING PROGRAMS FALL 2011 TO FALL 2013 / SOURCE: IRPO |
| Students seat cost |
Seat Cost The only seat cost data available at the IRPO web site as of this writing were for the academic year 2012-2013 (Table-20 and Chart-22). A close look at these data indicates that BUA program is among those with the lowest seat cost, i.e., third lowest in fall 2012 ($50) and second in spring 2013 ($59). Also in fall, its seat cost is almost five times that of Marine Science which had the highest cost ($234) for the same period. The BUA seat cost is 29% and 37% lower than the cost reported for National Campus for both semesters respectively. Seat costs for all programs, when averaged altogether, is almost twice (188%) as costly as that of BUA for fall 2012, and a little less than that (158%) in spring 2013. TABLE-20. NATIONAL CAMPUS PROGRAM SEAT COST PER CREDIT HOUR AY 2012-2013 / SOURCE: IRPO CHART-22. NATIONAL CAMPUS PROGRAM SEAT COST PER CREDIT HOUR AY 2012-2013 / SOURCE: IRPO Note that the seat cost presented in this report (and taken from the IRPO website) is by credit instead of by student. No information was provided as to how the seat cost was calculated. Back in the early part of 2012 there was discussion about student seat cost in an attempt to come up with a standard formula. The task was assigned to the IRPO, with assistance from the Comptoller, as recommended by faculty in the CAC and PRC. In gathering cost data, the Comptoller sought faculty’s input, which brought about confusion in the process. As the ALO aptly put it, “When left to many faculty, accuracy may be lost. What was desired was a consistent, accurate calculation of seat cost (that wasn’t subjected to individual faculty interpretation and thus potential error).” This writer proposed an alternative approach and shared his ideas with some colleagues, as well as with the DAP, ALO, and the President. Following the consultative process, he then presented it to the CAC, which acted to recommend the adoption of the proposed formula and pass it on to PRC. In May 1st 2012 letter, PRC Chair, Christopher Ross Perkins, officially submitted three recommendations to the President Daisy regarding seat cost determination. The discussions died down, and nothing was heard of about seat cost to date, so this writer is left wondering how the IRPO came up with its seat cost data. |
| Cost of Redundant Courses, Programs or Services | None |
| Students’ satisfaction rate | No data available. |
| Alumni data |
As mentioned earlier, the Business Administration Division conducted an online alumni survey covering its four programs. The results of that survey pertaining to the BUA program are presented and discussed on pages 24-32 of this report. |
| Employment Data and Employer Satisfaction Rate |
No data available on employer feedback. However, the alumni survey conducted by the division in 2015 reveal some information about employment of program graduates, such as name of current employer and type of organization, whether government or private sector, how long they have been with the company, and whether or not they are able to use the knowledge and skills that they learned from their program in their line of work. |
| Program added or cancelled at nearby regional institutions (PCC, GCC, Hawaii schools, UOG, CMI, NMC) | No data available. |
| Transfer rate |
No data available. The photographs below, however, give partial insight into where some of our program students continue and complete their studies after getting their A.S. or T.C.Y. degree from COM-FSM. MARY JOYCE PULMANO GRADUATED CUM LAUDE (RIGHT) AT THE UNIVERSITY OF GUAM WITH A BACHELOR OF BUSINESS ADMINISTRATION IN ACCOUNTING, SPRING 2015. Photo credit: UOG Flicker photos TIFFANY SANCHEZ (LEFT, BACHELOR OF BUSINESS ADMINISTRATION IN ACCOUNTING) AND TAMAE WAGUK (RIGHT, BACHELOR OF BUSINESS ADMINISTRATION WITH FINANCE AND ECONOMICS CONCENTRATION) ALSO GRADUATED FROM U.O.G. IN SPRING 2015. Photo credit: UOG Flicker photos CHRIS YAMADA, WHO SERVED AS PRESIDENT OF THE YOUNG EXECUTIVES SOCIETY (YES!) DURING ACADEMIC YEAR 2012-2013 (LEFT PHOTO), GRADUATED WITH A BECHELOR’S DEGREE IN BUSINESS ADMINISTRATION, MAJOR IN MANAGEMENT, FROM THE UNIVERSITY OF HAWAII (HILO) IN SPRING 2015. Photo credit: Grabbed from Yamada’s Facebook wall PROF. RAFAEL PULMANO (FOURTH FROM LEFT AND WITH CHILD), WITH COM-FSM ALUMNI CURRENTLY CONTINUING THEIR STUDIES AT THE UNIVERSITY OF GUAM. STANDING NEXT TO HIM (LEFT TO RIGHT) ARE GRADUATES OF THE BUSINESS DIVISION’S BUA PROGRAM: JUDY WILBUR, TROY CHIWI, AND ALLSTON ABRAHAM. |
| Business Administration Division Alumni Survey |
The Business Administration Division launched an alumni survey in Spring 2015 as part of its initiative to track the graduates from the different programs that it offers. Prof. Rafael Pulmano drafted the questionnaire. He shared the draft with his colleagues in the division, who in turn gave their suggestions and feedback. He then forwarded the final version of the questionnaire (Appendix A) to Prof. Timothy Mamangon, who used it as basis for creating an online survey form in Google Docs (Appendix B). The online survey went live in April 2015 (https://docs.google.com/forms/d/e/ 1FAIpQLSelYuuG3rX4eiTe0LtA14hkD7nrf5EOVU-GZwPMbt2Ppb1r5w/viewform). Data input from the first respondent was received on April 9, 2015. |
| Promoting the Survey |
To reach as many targeted respondents as possible, the division announced the survey by posting an invitation through Facebook, submitting a short article for publication in the college’s myShark news feed, and passing on the information by word of mouth. On Facebook, Prof. Mamangon posted a message and link to the online survey in the Young Executives Society’s Page (Exhibit 1). On Facebook, Prof. Mamangon posted a message and link to the online survey in the Young Executives Society’s Page (Exhibit 1). EXHIBIT 1 – ANNOUNCEMENT OF SURVEY ON YES! FACEBOOK PAGE EXHIBIT 2 – ANNOUNCEMENT OF SURVEY IN THE COLLEGE WEB SITE |
| Responses Received |
The last survey input was received on July 5, 2015, bringing the total responses to 73. Of this total, however, four duplicate entries were found and deleted, resulting in the final tally of 68. |
| About the Respondents |
Graduates of COM-FSM for the past 20 years, from 1995 to 2015, participated in the survey. None of the 1997 graduates, however, were able to join. Some respondents reported graduating twice because they earned two degrees/certificates from the college. The year with the most number of responses (9 graduates, or 14.5%) was 2014 (next page, Exhibit 3). EXHIBIT 3 – NUMBER AND PERCENT OF RESPONDENTS ACCORDING YEAR THEY GRADUATED FROM COM FSM SOURCE: GOOGLE DOCS The chart below (Exhibit 4) shows that 31 respondents received their A.S. degree in Business Administration at COM-FSM. Some respondents, however, left the entry field for this particular question empty, which, when subsequently completed, brought the final total to 34 (See also Exhibit 5). EXHIBIT 4 – NUMBER AND PERCENTAGE OF RESPONDENTS BY DEGREE OR CERTIFICATE EARNED AT COM-FSM SOURCE: GOOGLE DOCS |
| Survey Results for A.S. Business Administration |
The survey results presented thus far were those of the four programs under the Business Administration Division. In this section, presentation of results shall focus on the specific program under review, i.e., Associate of Science in Business Administration. As previously mentioned, the actual number of respondents who received their degree in Business Administration was 34. Of these, 12 (or 35%) also earned another degree or certificate from the college (Exhibits 5 and 6). EXHIBIT 5 – NUMBER AND PERCENT OF RESPONDENTS ACCORDING DEGREE/CERTIFICATE RECEIVED FROM COM-FSM / SOURCE: GOOGLE DOCS EXHIBIT 6 – PERCENTAGE OF RESPONDENTS ACCORDING DEGREE/ CERTIFICATE RECEIVED FROM COM-FSM / SOURCE: GOOGLE DOCS In response to the question regarding their present employer, six (or 18%) said that they are now working at COM-FSM. Ten (or 29%) did not respond (Exhibits 7 and 8). EXHIBIT 7 – NUMBER OF RESPONDENTS ACCORDING TO CURRENT EMPLOYER/COMPANY SOURCE: GOOGLE DOCS EXHIBIT 8 – PERCENTAGE OF RESPONDENTS ACCORDING TO CURRENT EMPLOYER/COMPANY SOURCE: GOOGLE DOCS Ten (or 29%) of the 34 respondents have been working with their current employers for two years or less, while nine (or 26%) reported 3-5 years. Five (or 15%) said they have been with the same employer for more than 10 years (next page, Exhibits 9 and 10). EXHIBIT 9 – NUMBER AND PERCENT OF RESPONDENTS ACCORDING TO THEIR YEARS OF SERVICE WITH CURRENT EMPLOYER/COMPANY SOURCE: GOOGLE DOCS EXHIBIT 10 – PERCENT OF RESPONDENTS ACCORDING TO THEIR YEARS OF SERVICE WITH CURRENT EMPLOYER/COMPANY SOURCE: GOOGLE DOCS An equal number of respondents (11, or 32%) say they work for a private firm and the government. Two (or 6%) are self-employed, while 10 (29%) didn’t respond to the question (Exhibits 11 and 12). EXHIBIT 11 – NUMBER AND PERCENT OF RESPONDENTS ACCORDING TO EMPLOYMENT SECTOR SOURCE: GOOGLE DOCS EXHIBIT 12 – NUMBER ANDRESPONDENTS ACCORDING TO EMPLOYMENT SOURCE: GOOGLE DOCS When asked whether they were able to use the knowledge and skills that they learned from their degree or certificate program in their first job after graduating from COM-FSM, 76% of the respondents replied in the affirmative, with 61% saying they use them in their first job either all or most of the time. Only one returned a negative response, while two indicated “not applicable”. Five did not respond to the question (Exhibits 13 and 14). EXHIBIT 13 – NUMBER AND PERCENT OF RESPONDENTS ABLE TO USE KNOWLEDGE/SKILLS IN FIRST JOB SOURCE: GOOGLE DOCS EXHIBIT 14 – PERCENTAGE OF RESPONDENTS ABLE TO USE KNOWLEDGE/SKILLS IN FIRST JOB The same question was asked regarding the application of knowledge and skills that they learned from their degree or certificate program from COM-FSM, but this time with respect to their current job, and 14 (or 41%) said they use those all the time, while 8 (or 24%) said Yes, most of the time. Two (or 6%) of the respondents reported being unable to apply their knowledge and skills from the program because those are not at all related to their current job, while seven (or 21%) did not respond (Exhibits 15 and 16). EXHIBIT 15 – NUMBER AND PERCENT OF RESPONDENTS ABLE TO USE KNOWLEDGE/SKILLS IN CURRENT JOB SOURCE: GOOGLE DOCS EXHIBIT 16 – PERCENTAGE OF RESPONDENTS ABLE TO USE KNOWLEDGE/SKILLS IN CURRENT JOB The division survey yielded 17 comments/suggestions from respondents. Of these, nine came from the alumni of the A.S. in Business Administration program. Five of nine comments expressed interest, support, request, hope or longing for the 4th Year or Bachelor’s degree program to be offered by COM-FSM’s Business Administration Division. One was looking forward to the offering of online courses by the college, and two voiced their appreciation to the college and the division faculty for their guidance and assistance. Below are their actual comments/suggestions in the survey: |
| PSLOs Assessed |
In this section, we review the assessment of student learning outcomes at the program level for A.S. Business Administration. As mentioned earlier, program faculty launched the Food & Fashion Friday Festival (F4) as an authentic assessment tool to determine the extent by which students meet the PSLOs. Designed to (1) foster integration among program major courses through synchronized, complementary, and collaborative projects in order to improve the overall student learning experience, and (2) use the resulting information from the projects as material for authentic program assessment, F4 puts into practice what Suskie (2009) observed, “Students learn best––and assessment works best––when education is a purposeful, integrated, collaborative experience.” All five student learning outcomes of the BUA program were assessed during the assessment cycle 2014-2016. As shown in Table-21 and Table-22, PSLOs 1, 3 and 5 were assessed in the first half of the cycle, while PSLOs 1 (again), 2 and 4 were assessed in the second half. TABLE-21. BUA PROGRAM STUDENT LEARNING OUTCOMES ASSESSED IN 2014-2016 / SOURCE: BUA PAS REPORTS FOR 2014-2015 AND 2015-2016 In the 2014-2015 assessment cycle, the BUA faculty met to prepare a mapping document that specified how the PSLOs would be met at the course level (Table-22). Having identified the courses to be used in assessing each PSLO, strategies were formulated (Table-23) and later executed within the framework of the F4 Project. The process was repeated in 2015-2016. BUA faculty who taught courses that were covered by this project came up with a uniform grading rubric which assessed student performance according to the following scale and assigned values: Did Not Meet Expectations (69% and below); Met Expectations (70%-89%); and, Exceeded Expectations (90%-100%). The results are shown in Table-24. Although results indicated that an average of 89.3% of the students assessed using the various program courses either met or exceeded expectations, something the division should be proud of, weaknesses were identified and plans proposed to keep improving the program and the F4 experience. As of this writing, talks were already underway, largely through the initiative of Prof. Timothy Mamangon, to expand F4 with the possible participation of the other programs both at the National and Pohnpei Campus. Likewise, the Center for Entrepreneurship is relentless in its efforts to provide resources and training support to the program students and F4 participants. TABLE-22. COURSES USED TO ASSESS BUA PROGRAM STUDENT LEARNING OUTCOMES IN 2014-2016 SOURCE: BUA PAS REPORTS FOR 2014-2015 AND 2015-2016 TABLE-23. ASSESSMENT STRATEGIES FOR THE COURSES USED TO ASSESS BUA PROGRAM STUDENT LEARNING OUTCOMES IN 2014-2016 / SOURCE: BUA PAS REPORTS FOR 2014-2015 AND 2015-2016 TABLE-24. AUTHENTIC ASSESSMENT RESULTS BASED ON RUBRICS FOR BUA PROGRAM IN 2014-2016 SOURCE: BUA PAS REPORTS FOR 2014-2015 AND 2015-2016 |
| Analysis and Recommendation | |
| Findings |
The following findings are gleaned from the program indicators reviewed in this report: |
| Recommendations | Based on the findings discussed in the preceding section, the following recommendations are proposed: Closing the Loop Recommendations from Previous (2012-2014) Review Cycle
ACTIONS TAKEN: The Business Administration Division had its first orientation workshop at MITC for all Business, Accounting and CIS students in 2016. Among the invited resource speakers were graduates of the division’s A.S. and T.Y.C. programs who shared their personal success stories and how their education and experiences at COM-FSM became their stepping stone to where they are now. A significant portion of the program was devoted to orienting both freshmen and continuing/returning students in the program courses and credits they need to complete and suggested pathways to graduate on time. The Young Executives Society ( YES!) continues to actively engage new and continuing students by encouraging them to join and become officers/members of the student association.The special bond created among member-students and the collective challenges they face as business decision makers in a campus environment all contribute to their motivation to continue and complete their studies at the college. From its opening date to present, the Center for Entrepreneurship of COM-FSM has been consistent and aggressive in offering its facilities and providing training and financial support to the division’s programs and students. Prof. Timothy Mamangon has been designated as the division’s lead faculty in all communication and collaborative activities with the Center. The multifarious opportunities and added prestige of being associated with the Center are another reason for program students to enjoy their college life and look forward to a rewarding career in the years ahead. ACTION TAKEN: Business Division Chair did not follow up recommendations from last review cycle and will work with VPIA office along this cycle recommendation. ACTION TAKEN: Business Division Chair did not follow up recommendations from last review cycle and will work with VPIA office along this cycle recommendation. ACTION TAKEN: Business Division Chair did not follow up recommendations from last review cycle and will work with VPIA office along this cycle recommendation. ACTION TAKEN: None ACTION TAKEN: Same as #3 above ACTION TAKEN: Business Division Chair did not follow up recommendations from last review cycle and will work with VPIA office along this cycle recommendation. ACTION TAKEN: In connection with the student orientation mentioned earlier, this was one of the points emphasized by some of the speakers. ACTION TAKEN: Business Division Chair did not follow up recommendations from last review cycle and will work with VPIA office along this cycle recommendation. ACTION TAKEN: Business Division Chair did not follow up recommendations from last review cycle and will work with VPIA office along this cycle recommendation. ACTION TAKEN: Business Division Chair did not follow up recommendations from last review cycle and will work with VPIA office along this cycle recommendation. ACTION TAKEN: Business Division Chair did not follow up recommendations from last review cycle and will work with VPIA office along this cycle recommendation. ACTION TAKEN: Program faculty advised students accordingly, but only if they show up during registration period. There were times, however, when early registration is announced or extended without prior notice, and also instances when registration is held when faculty are supposed to be on break, and yet they are expected to be available for the task. There are two options that they could explore if they allow us to use a Database in our own personal websites, namely: If they are going to let us use mySQL database, they could make a Virtual server (using Virtualization or VM) that would run the mySQL server thus not interfering or endangering their own mySQL database for SIS/MyShark Second option would be if they give us Write permission in our respective personal folders for our websites that would allow us to put a Sqlite database which is a serverless type of database which does not need any centralized server like in option number 1.This option by the way I was asking from Shaun and until now they did not give any respond back. Outside the above options we could also explore of renting a domain and a Web server that would house the database and our program for our tutorials. And that would mean we will just put a link in our website to point our students to that link. And that would also mean that Business Division will have to shell out an annual payment for the domain and web server which will cost only around $60 or more every year for starter package. ACTION TAKEN: None ACTION TAKEN: Business Division Chair did not follow up recommendations from last review cycle and will work with VPIA office along this cycle recommendation. |
This website and all COM-FSM Internet based services are best viewed with Firefox 3.0 or better.
© Copyright 2026 College of Micronesia-FSM | Site Disclaimer
P. O. Box 159, Kolonia, Pohnpei, 96941 - (691) 320-2480
College of Micronesia-FSM is accredited by the Accrediting Commission for Community and Junior Colleges,
Western Association of Schools and Colleges, 428 J Street., Suite 400 Sacramento, CA 95814, (415) 506-0234,
an institutional accrediting body recognized by the Council for Higher Education Accreditation and the U.S. Department of Education.
Additional information about accreditation, including the filing of complaints against member institutions, can be found at: www.accjc.org