- Our College
- Academics
- Student Services
- Public Reports
- Forum
- Library
- Quick Access
Program Student Learning Outcomes (PSLOs)
At the completion of the Liberal Arts Program, the student will be able to:
PSLO Assessment Report Summary
What we looked at:
ASSESSMENT ACTIVITY: For the 2017-2018 SY, the division will be assessing the Transfer-ability of our students in the Liberal Arts program. These assessment activities will help us to assess PSLO # 3 which is: Demonstrate fundamental knowledge and basic skills appropriate to their personal and professional goals in their chosen area of specialization.
Target: 100% of all of our current Liberal Arts students will be assessed.
What we found:
As we analyzed the GPAs of our current advisees, here is what we were able to find:
Raw Data:
Findings:
A survey with five questions were given to the Liberal Arts students to determine factors that affected their ability to transfer, their knowledge of the transfer process and what their goals are after they leave or graduate. Here is what we found:
Sample size: 50 students with 26 being Female and 24 males.
Question #1: Would you transfer to another institution if you had a scholarship?
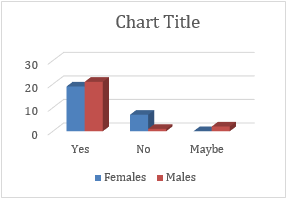
19 Females and 21 males responded yes to the question. Seven females said no, they would not transfer even with a scholarship compared to one male who said no and two who responded with “maybe”.
Question #2: What do you plan to do after you leave COM-FSM?
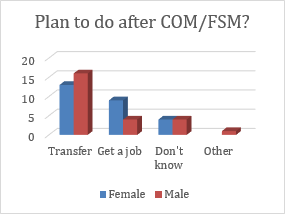
13 females said they would transfer after COM-FSM; 9 females said they would get a job and 4 responded with “Don’t know.” In comparison, 16 males said they would transfer after COM-FSM, 4 males plan to get jobs while 4 males were unsure. One male responded twice with maybe and Military.
Question #3: When is the best time to start the transfer process?
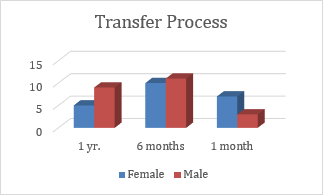
We found that a majority of the respondents felt that 6 months before you plan to transfer is the best time to start the transfer process with 11 males and 10 females while 14 (5 females and 9 males) felt one year was the best time and 10 students (7 females and 3 males) felt that one month prior is the best time.
*Although it is possible to complete the process within 6 months, it may not be the most feasible for our students since they may miss deadlines and not be able to get together all of the necessary documents. So with this data, our division will have to work on advising students to start the transfer process earlier if that is they plan so that they can have everything in place prior to transferring.
Question #4: Students were asked to rank from top to lowest the reason that would prevent them from transferring to another institution.

We found that money was the top reason for students not transferring with 25 respondents (12 female and 13 males) while family came in a close second with 22 students (12 female and 10 males) naming this as their top reason for not transferring. Only 3 students indicated that new culture or place was a top reason for them not to transfer (2 females; 1 male).
By finding out that money is the top issue, one way we can assist our students is to guide and help them find scholarships to help finance their educations. Some students are not aware of available scholarships so to help increase and improve chances for our students to transfer we need to work on identifying alternative sources of funding for them.
Question #5: Rank in order what you should do first in the transfer process:
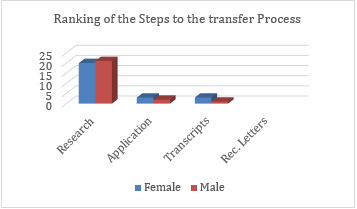
Based on our survey, it is apparent that more than half of our students understand that they need to do research in order to find out what is needed to be done if they plan to transfer. Forty-one of the respondents indicated that this is the first step (20 females; 21 males). Five indicated that filling out and sending in the application should be the first step while four respondents chose requesting transcripts as the first step. All of the respondents indicated requesting for letters of recommendation as the last step.
Although the students knew that they needed to do research, we were not able to ascertain as to what type of research they needed to do and what type of information they would need to find. This data has thus provided us with ideas on what kind of information we can help them find when they are working on transferring. Moreover, we can assist them in encouraging them to request transcripts and letters of recommendations in a more timely manner and that it does not necessarily need to be done when they start the process but can even be done prior to their starting the process.
What we are planning to work on:
ASSESSMENT ACTIVITY 2018-2019: The Liberal Arts Program has already in subsequent years, looked at the three PSLOs for the program and has conducted assessment activities for these PSLOs. As a result, for the SY 2018-2019, the Liberal Arts faculty have decided to do an overall assessment of the program’s PSLOs and its mission statement. The program faculty in doing the assessments of its students have found that for the most part, many of our students enter the program for three main reasons:
DUTIES/TASKS TO COMPLETE:
The division will meet three times during the semester to review, revise and finalize the PSLOs and the program mission. Tentative dates are as follows:
September 5th ---Review/discuss possible changes to the mission and PSLOs
September 19th—Revisions
October 17th—Finalizing all suggested revisions/preparing for submission; also we plan to start working on our program review after the completion of the program assessment as our new due date is at the end of Spring 2019.
Recommendations for students:
Download PDF Version of the Data Sheet Spring 2016
AP Full Official |
Liberal Arts |
||
Campus |
National campus |
AP Review Submission Date |
August 26, 2016 |
Completed by |
Resida S. Keller, Languages & Literature Division Chairperson |
AR Review Cycle |
2014-2015 |
Program Goals |
|||
| Program goals are broad statements concerning knowledge, skills, or values that the faculty members expect the graduating students to achieve. | |||
Upon successful completion of this degree program, students will be able to: 1. Enrich and deepen self-knowledge by exploring different academic experiences. |
|||
| Program History | |||
This section describes the history of the program. This includes the date and reason of implementation, significant milestones in the development of the program, and significant current activities. |
|||
The Associate of Arts degree program in Liberal Arts was established in 1975 to enable students to transfer to a four-year college, university, or other institution. Other than the addition and establishment of more focused and area-specific liberal arts degrees such as the Liberal Arts/Media studies and the Liberal Arts/Education programs (adopted in 1997) or the Liberal Arts/HCOP [Health Careers Opportunities Program], there have been no major changes to the structure of the Liberal Arts program in the past 10 years. The program learning outcomes (above) for the L.A. Degree program were adopted in Spring 2005. |
|||
Program Description |
|||
The program description describes the program, including its organization, relationship to other programs in the system, program design, degree(s) offered, and other significant features of the program, such as elements/resources for forward-looking new program contributions to the state’s economy, or specialized program accreditation. |
|||
1. Organization: The Liberal Arts program is currently organized with the Chairperson of the Languages and Literature division being the person responsible for collection of SLO information from faculty and responsible for implementation of assessment activities and any improvement plans. All academic divisions at the National campus contribute to the Liberal Arts program. Students completing this program receive an Associate of Arts degree which often leads to the transferring to other institutions of higher education within the region and the United States for more specialized study. 2. Relationship to other programs in the system: The liberal Arts program is one of the two-year academic majors offered at the National campus of COM-FSM. Many of the courses in the Liberal Arts program are either major course requirements for other programs or it shares courses with other majors. For example, as part of the program requirements, students are required to take courses in the natural sciences, social sciences, health sciences, humanities and language arts. |
|||
Program Admission Requirements |
|||
This section describes the requirements for admission into the program and other requisites. |
|||
All students accepted for admission into the college are eligible to enter/major in the Liberal Arts program. Currently, students undecided on a major are also listed as Liberal Arts majors until they decide otherwise. The college’s admissions criteria is listed on the college website at http://www.comfsm.fm/publications/catalog-2015-2016 requirements.pdf. These criteria are followed when admitting students into the Liberal Arts program. |
|||
| Program Certificate/Degree Requirements | ||||
| This section specifies the requirements for obtaining a certificate/degree in the program, including specific courses,, sequencing of courses, total credits, internships, practical, etc. | ||||
The Liberal Arts program as it currently stands consists of General Education Core Requirements in English [9 credits], Natural Sciences [7 credits], Mathematics, Social Sciences, Computer Applications and Humanities [3 credits each], and Exercise Sports Science [1 credit]. In addition to General Education core requirements, there are the Major Requirements which include the following courses: three credits for each of these courses---Speech Communication (EN/CO 205), Health Science (SC 101), Introduction to Sociology (SS 130), General Psychology (SS/PY 101); three credits each of a 200-levelEnglish course and Humanities elective, six credits of any classes from either the Natural Science or Social Science group of courses and nine credits of open electives, totaling up to sixty-two credits (62) required for an Associate of Arts degree. Currently students are encouraged to follow a specified sequence of courses so that they are able to complete the program within two years.
Source: General Catalog 2015 – 2016 pg. 49 http://www.comfsm.fm/catalog/2015-2016/Catalog-2015-2016.pdf |
| Program Courses and Enrollment |
This section lists courses offered in the program, including number of sections, course enrollment, section fill rates, and redundancy of courses across the institution. |
| Program | Term | Sections | Enroll Max | Enroll | AVGclassSize |
| Liberal Arts(AA) | FALL 2014 | 21 | 548 | 411 | 19.6 |
| Liberal Arts(AA) | FALL 2015 | 16 | 393 | 302 | 18.9 |
| Liberal Arts(AA) | Spring 2014 | 23 | 546 | 410 | 17.8 |
| Liberal Arts(AA) | Spring 2015 | 20 | 520 | 392 | 19.6 |
The data shows that there are more sections offered during the Spring semester than the Fall semester, and also more classes offered during 2014 than in 2015 respectively; the actual total enrollment in courses within the program ranged from a low 302 up to a high of 411 during this assessment cycle and class sizes dropped with Fall and Spring 2014 having the highest class enrollment and Fall and Spring 2015 seeing a drop in class enrollment. Enrollment numbers have dropped since the beginning of the assessment cycle in 2014 and have steadily followed a downward trend in 2015-16.
Below are listed the course requirements for the program along with the sections of each course offered each semester during this assessment cycle.
Program Course Requirements |
SP 14 |
Fall 14 |
SP 15 |
Fall 15 |
SP 16 |
EN/CO 205 Speech Comm. |
4 |
4 |
3 |
2 |
2 |
SC 101 Health Science |
6 |
4 |
7 |
4 |
4 |
SS 130 Intro. To Sociology |
2 |
2 |
2 |
2 |
2 |
SS/PY General Psychology |
3 |
333 |
3 |
2 |
2 |
| EN 201 Intro to Literature | 3 | 4 | 4 | 1 | 1 |
| EN 208 Intro to Philosophy | 4 | 3 | 2 | 2 | 2 |
| EN 209 Intro to Religion | 1 | 1 | 1 | 0 | 0 |
Humanities Elective
Program Course Requirements |
SP 14 |
Fall 14 |
SP 15 |
Fall 15 |
SP 16 |
AR 101 Intro to Art |
1 | 3 | 5 | 4 | 4 |
MU 101 Intro to Music |
4 | 4 | 4 | 4 | 4 |
SS 170 History I |
1 | 2 | 1 | 1 | 0 |
| SS 171 History II | 1 | 0 | 1 | 0 | 1 |
| EN 201 Intro to Literature | 3 | 4 | 4 | 1 | 1 |
| EN 208 Intro to Philosophy | 4 | 3 | 2 | 2 | 2 |
| FL 101 Japanese I | 3 | 3 | 2 | 2 | 2 |
| FL 102 Japanese II | 1 | 0 | 1 | 1 | 0 |
| FL 103 Chinese I | 2 | 2 | 2 | 2 | 2 |
FL 104 Chinese II |
0 | 0 | 0 | 0 | 0 |
| Program Faculty |
This section reports the faculty of the program, including full-time and part-time faculty. The degrees held and rank are provided for the full-time and part-time faculty. Finally, provide the faculty student ratio for the program. |
The program faculty consists of faculty members from the different academic divisions of the college. The Liberal Arts program is taught by a unique mix of the college’s existing faculty members as the program requirements consist of courses that come from many of the different divisions of the college. The Languages and Literature Division faculty, for the most part, act as advisors and teachers to the students who choose Liberal Arts as their major. Here is a list of the current faculty members of the Liberal Arts program:
Biza, Leilani : (Languages and Literature) Devanesam Senarathgoda (Languages/Literature) Gonzales, Jazmin: ( Math/Scienc; HCOP coordinator) Haglelgam, John: (Social Science) Kamikubo, Akiko: (Languages and Literature) Keller, Resida: (Languages and Literature) |
John, Rathnamony Jothy (Languages/Literature) Paul, Kasiano: (Languages and Literature) Rivera, Monica: (Languages and Literature) Manuel-Ehmes, Delihna: (Social Science) Sam, Lucy Donre: (Social Science) Yumei Helen Gao |
Program Indicators |
This section provides the data for analyzing the extent to which the program has achieved the established outcomes and criteria. This is the most important part of the program review. The data that will be collected and evaluated are the following: |
Assessment of course student learning outcomes of program courses |
All assessments of courses offered under the Liberal Arts program for the Spring/Fall 2014 and Spring/Fall 2015 semesters can be found on the college’s TracDat page with special access/permission required. |
|||||||||||||||||||||||||||||||||||||||||||||||||||||||||||||||||||||||||||||||||||||||||||||||||||||||||||||||||||||||||||||||||||||||||||||||||||||||||||||||||||||||||||||||||||||||||||||||||||||||||||||||||||||||||||||||||||||||||||||||||||||||||||||||||||||||||||||||||||||||||||||||||||||||||||||||||||||||||||||||||||||||||||||||||||||||||||||||||||||||||||||||||||||||||||||||||||||||||||||||||||||||||||||||||||||||||||||||||||||||||||||||||||||||||||||||||||||||||||||||||||||||||||||||||
| Assessment of program student learning outcomes |
Listed below is the summary of what we looked at and what we found.
Listed below are the results of the assessment of 107 Japanese students and 48 Chinese students.
Chinese Course:
Based on the assessment, it seems that our students are doing fairly well when it comes to learning another foreign language in comparison to English. What we looked at:ASSESSMENT ACTIVITY: For the 2015-2016 SY, the students in all of the Advanced Reading courses were assessed on their ability to comprehend and summarize the reading information from a pre-selected article. Students had to demonstrate the ability to identify and extract specific information from the reading such as facts, definitions, antonyms and synonyms as well as main ideas and contradictory information based on their readings. These assessment activities covered PSLO 2 of the Liberal Arts program with a specific focus on students’ reading abilities. During the Fall 2015 semester, the assessment was done as a summative assessment at the end of the semester. During the Spring 2016 semester, the assessment was given as both a pre and post- test and then the results were also compared to the summative results of students from the previous semester.TARGET: 100% of all students who took the EN 110 Advanced Reading classes during the year (Fall 2015 and Spring 2016) were assessed. Since this class is a general education class, it allowed us to look at all the students in general as well as how students from different majors were doing in comparison to Liberal Arts students.Listed below are the results of the assessment of 211 students who were assessed in our Advanced Reading courses during the 2015-2016 School Year.What we found:For the Fall summative assessment, 128 students were assessed in seven sections of EN 110. The assessment tool consisted of six specific questions that assessed students’ abilities of distinguishing, identifying and showing understanding of the following information:1. Main Idea; 2. Purpose; 3. Important details: Cause/Effect; 4. important details: Contradictory Information; 5. important details: FACTs; and 6. Theme.Of the 128 students, here is what we found:? No class scored above 70% on questions 3, 4 and 6 indicating that the EN 110 classes need to focus more on helping students identify important details such as Causes/Effects (#3), contradictory information (#4) and theme (#6). ? For question 3, in the section that performed the lowest, 22% of the students got this question correct while in the section that performed the highest, 55% of the students got this question correct. Overall, only 36% or 46 students out of 128 got this question correct. ? For question 4, in the section that performed the lowest, 0% of the students got this question correct while in the section that performed the highest, 40% of the students got this question correct. Overall, only 23% or 30 students out of 128 got this question correct. ? For question 6, in the section that performed the lowest, 14% of the students got this question correct while in the section that performed the highest, 33% of the students got this question correct. Overall, only 27% or 35 students out of 128 got this question correct. ? All of the sections performed at 70% or higher for questions 1,2 and 5 which indicates that students may have a greater understanding of Main idea (#1), Purpose (#2) and Important details: Facts (#5) when reading. ? For question 1, overall, 77% or 99 students out of 128 got this question correct. ? For question 2, overall, 71% or 91 students out of the 128 got this question correct. ? For question 5 overall, 83% or 106 students out of the 128 got this question correct.For the Spring 2016 assessment, 83 students were assessed for both the Pre and Post assessments. Although more students were enrolled in the EN110 sections, many students did not take the post-test or had incomplete post-tests therefore the number of students whose assessment performance was assessed were only those who took both.Of the 83 students, here is what we found:? For questions 1 and 2 in the pre-test, only one section each was able to score above 70% overall while in the post-test, two of the sections assessed were able to score above 70% overall for both questions. |
|||||||||||||||||||||||||||||||||||||||||||||||||||||||||||||||||||||||||||||||||||||||||||||||||||||||||||||||||||||||||||||||||||||||||||||||||||||||||||||||||||||||||||||||||||||||||||||||||||||||||||||||||||||||||||||||||||||||||||||||||||||||||||||||||||||||||||||||||||||||||||||||||||||||||||||||||||||||||||||||||||||||||||||||||||||||||||||||||||||||||||||||||||||||||||||||||||||||||||||||||||||||||||||||||||||||||||||||||||||||||||||||||||||||||||||||||||||||||||||||||||||||||||||||||
| Program enrollment (historical enrollment patterns, student credits by major) | LIBERAL ARTS PROGRAM ENROLLMENT DATA (SPRING 2014-FALL 2015) Spring 2014 Enrollment by Major and Campus
Fall 2014 Enrollment by Major and Campus
Spring 2015 Enrollment by Major and Campus
Fall 2015 Enrollment by Major and Campus
Enrollment by Major and Campus
|
|||||||||||||||||||||||||||||||||||||||||||||||||||||||||||||||||||||||||||||||||||||||||||||||||||||||||||||||||||||||||||||||||||||||||||||||||||||||||||||||||||||||||||||||||||||||||||||||||||||||||||||||||||||||||||||||||||||||||||||||||||||||||||||||||||||||||||||||||||||||||||||||||||||||||||||||||||||||||||||||||||||||||||||||||||||||||||||||||||||||||||||||||||||||||||||||||||||||||||||||||||||||||||||||||||||||||||||||||||||||||||||||||||||||||||||||||||||||||||||||||||||||||||||||||
| Average class size | Total Program Sections by Major, term,sections and Average Class Size
The average class size is capped for all Liberal Arts courses between 20-25 students. According to the data above, the average class size of most of the Liberal Arts classes during this assessment period fell between 18-20 students, which is a reasonably sized number for optimum instruction with consideration of our teaching facilities, equipment and other resources.
|
|||||||||||||||||||||||||||||||||||||||||||||||||||||||||||||||||||||||||||||||||||||||||||||||||||||||||||||||||||||||||||||||||||||||||||||||||||||||||||||||||||||||||||||||||||||||||||||||||||||||||||||||||||||||||||||||||||||||||||||||||||||||||||||||||||||||||||||||||||||||||||||||||||||||||||||||||||||||||||||||||||||||||||||||||||||||||||||||||||||||||||||||||||||||||||||||||||||||||||||||||||||||||||||||||||||||||||||||||||||||||||||||||||||||||||||||||||||||||||||||||||||||||||||||||
| Course completion rate |
|
|||||||||||||||||||||||||||||||||||||||||||||||||||||||||||||||||||||||||||||||||||||||||||||||||||||||||||||||||||||||||||||||||||||||||||||||||||||||||||||||||||||||||||||||||||||||||||||||||||||||||||||||||||||||||||||||||||||||||||||||||||||||||||||||||||||||||||||||||||||||||||||||||||||||||||||||||||||||||||||||||||||||||||||||||||||||||||||||||||||||||||||||||||||||||||||||||||||||||||||||||||||||||||||||||||||||||||||||||||||||||||||||||||||||||||||||||||||||||||||||||||||||||||||||||
| Course completion rate | Total course completion by program Program term enrolled W ABCorP W_% CC_%
Course completion rates show that overall rates were higher during the spring semesters. The lowest passing rate was in the Health Science course with a rate of 39.1% while the Humanities courses boasted the highest passing rates with student passing rates for the foreign languages, history, music and arts classes ranging from the high 70s to 100% passing rates consistently across the board. Social science courses had the next highest passing rates, followed by English classes and the natural science courses. |
|||||||||||||||||||||||||||||||||||||||||||||||||||||||||||||||||||||||||||||||||||||||||||||||||||||||||||||||||||||||||||||||||||||||||||||||||||||||||||||||||||||||||||||||||||||||||||||||||||||||||||||||||||||||||||||||||||||||||||||||||||||||||||||||||||||||||||||||||||||||||||||||||||||||||||||||||||||||||||||||||||||||||||||||||||||||||||||||||||||||||||||||||||||||||||||||||||||||||||||||||||||||||||||||||||||||||||||||||||||||||||||||||||||||||||||||||||||||||||||||||||||||||||||||||
| Student persistence rate (semester to semester) |
The data shows that persistence rates during the Fall 2014-Spring 2015 semesters were at a low rate of 76.% however, during the next year, students who started in Fall 2015 continued and persisted in their enrollment during the Spring of 2016 causing a dramatic increase as all of the students continued, along with two additional students. |
|||||||||||||||||||||||||||||||||||||||||||||||||||||||||||||||||||||||||||||||||||||||||||||||||||||||||||||||||||||||||||||||||||||||||||||||||||||||||||||||||||||||||||||||||||||||||||||||||||||||||||||||||||||||||||||||||||||||||||||||||||||||||||||||||||||||||||||||||||||||||||||||||||||||||||||||||||||||||||||||||||||||||||||||||||||||||||||||||||||||||||||||||||||||||||||||||||||||||||||||||||||||||||||||||||||||||||||||||||||||||||||||||||||||||||||||||||||||||||||||||||||||||||||||||
| Student retention rate (Fall-to-Fall for two-year programs; Fall-to-Spring for one-year programs) | The retention rate for Fall 2013 to Fall 2014 was 62.5% with 35 out of 56 students returning the next fall; and Fall 2014-to Fall 2015 retention rate was 68.6% with 35 returning out of 51 students. The retention rate increased slightly with an increase of 6.1% but remained steady in the 60+ percentage range. | |||||||||||||||||||||||||||||||||||||||||||||||||||||||||||||||||||||||||||||||||||||||||||||||||||||||||||||||||||||||||||||||||||||||||||||||||||||||||||||||||||||||||||||||||||||||||||||||||||||||||||||||||||||||||||||||||||||||||||||||||||||||||||||||||||||||||||||||||||||||||||||||||||||||||||||||||||||||||||||||||||||||||||||||||||||||||||||||||||||||||||||||||||||||||||||||||||||||||||||||||||||||||||||||||||||||||||||||||||||||||||||||||||||||||||||||||||||||||||||||||||||||||||||||||
| Success rates on licensing or certification exams (CTE, TP, Nursing, etc) | Not Applicable—Liberal Arts students are not required to take any exams for licensing or certification. | |||||||||||||||||||||||||||||||||||||||||||||||||||||||||||||||||||||||||||||||||||||||||||||||||||||||||||||||||||||||||||||||||||||||||||||||||||||||||||||||||||||||||||||||||||||||||||||||||||||||||||||||||||||||||||||||||||||||||||||||||||||||||||||||||||||||||||||||||||||||||||||||||||||||||||||||||||||||||||||||||||||||||||||||||||||||||||||||||||||||||||||||||||||||||||||||||||||||||||||||||||||||||||||||||||||||||||||||||||||||||||||||||||||||||||||||||||||||||||||||||||||||||||||||||
| Graduation rate based on yearly number |
Based on the above data, during this assessment cycle, none of the Liberal Arts graduates were able to complete the program within two years. Within three years, the rate improved with graduation rates resulting in a 30% increase. An additional 18% were able to graduate after four years or 200% time period. This shows that very few students are able to complete the program in the allotted two year period. When given a little bit more time to complete over the two year period, nine times more students were able to complete the program. The low graduation rates has propelled the Languages and Literature division into trying to work with our students closely in making good decision during course selection so that they can graduate within the allotted two years. Because there is no room for failure or make-up and typically for some courses, students need more time as they do repeat courses, course pre-requisites and the program courses’ connection to other programs is discussed with students so they can make wise choices on their courses and can decrease their chances of having to repeat a course. |
|||||||||||||||||||||||||||||||||||||||||||||||||||||||||||||||||||||||||||||||||||||||||||||||||||||||||||||||||||||||||||||||||||||||||||||||||||||||||||||||||||||||||||||||||||||||||||||||||||||||||||||||||||||||||||||||||||||||||||||||||||||||||||||||||||||||||||||||||||||||||||||||||||||||||||||||||||||||||||||||||||||||||||||||||||||||||||||||||||||||||||||||||||||||||||||||||||||||||||||||||||||||||||||||||||||||||||||||||||||||||||||||||||||||||||||||||||||||||||||||||||||||||||||||||
| Students seat cost | Not Available | |||||||||||||||||||||||||||||||||||||||||||||||||||||||||||||||||||||||||||||||||||||||||||||||||||||||||||||||||||||||||||||||||||||||||||||||||||||||||||||||||||||||||||||||||||||||||||||||||||||||||||||||||||||||||||||||||||||||||||||||||||||||||||||||||||||||||||||||||||||||||||||||||||||||||||||||||||||||||||||||||||||||||||||||||||||||||||||||||||||||||||||||||||||||||||||||||||||||||||||||||||||||||||||||||||||||||||||||||||||||||||||||||||||||||||||||||||||||||||||||||||||||||||||||||
| Cost of duplicate or redundant courses, programs or services | Not Applicable | |||||||||||||||||||||||||||||||||||||||||||||||||||||||||||||||||||||||||||||||||||||||||||||||||||||||||||||||||||||||||||||||||||||||||||||||||||||||||||||||||||||||||||||||||||||||||||||||||||||||||||||||||||||||||||||||||||||||||||||||||||||||||||||||||||||||||||||||||||||||||||||||||||||||||||||||||||||||||||||||||||||||||||||||||||||||||||||||||||||||||||||||||||||||||||||||||||||||||||||||||||||||||||||||||||||||||||||||||||||||||||||||||||||||||||||||||||||||||||||||||||||||||||||||||
| Students’ satisfaction rate | Not Applicable | |||||||||||||||||||||||||||||||||||||||||||||||||||||||||||||||||||||||||||||||||||||||||||||||||||||||||||||||||||||||||||||||||||||||||||||||||||||||||||||||||||||||||||||||||||||||||||||||||||||||||||||||||||||||||||||||||||||||||||||||||||||||||||||||||||||||||||||||||||||||||||||||||||||||||||||||||||||||||||||||||||||||||||||||||||||||||||||||||||||||||||||||||||||||||||||||||||||||||||||||||||||||||||||||||||||||||||||||||||||||||||||||||||||||||||||||||||||||||||||||||||||||||||||||||
| Alumni data | Not Applicable | |||||||||||||||||||||||||||||||||||||||||||||||||||||||||||||||||||||||||||||||||||||||||||||||||||||||||||||||||||||||||||||||||||||||||||||||||||||||||||||||||||||||||||||||||||||||||||||||||||||||||||||||||||||||||||||||||||||||||||||||||||||||||||||||||||||||||||||||||||||||||||||||||||||||||||||||||||||||||||||||||||||||||||||||||||||||||||||||||||||||||||||||||||||||||||||||||||||||||||||||||||||||||||||||||||||||||||||||||||||||||||||||||||||||||||||||||||||||||||||||||||||||||||||||||
| Employment data and employer feedback (employer survey) |
|
|||||||||||||||||||||||||||||||||||||||||||||||||||||||||||||||||||||||||||||||||||||||||||||||||||||||||||||||||||||||||||||||||||||||||||||||||||||||||||||||||||||||||||||||||||||||||||||||||||||||||||||||||||||||||||||||||||||||||||||||||||||||||||||||||||||||||||||||||||||||||||||||||||||||||||||||||||||||||||||||||||||||||||||||||||||||||||||||||||||||||||||||||||||||||||||||||||||||||||||||||||||||||||||||||||||||||||||||||||||||||||||||||||||||||||||||||||||||||||||||||||||||||||||||||
| Program added or cancelled at nearby regional institutions (PCC, GCC, Hawaii schools, UOG, CMI, NMC) | Not Available | |||||||||||||||||||||||||||||||||||||||||||||||||||||||||||||||||||||||||||||||||||||||||||||||||||||||||||||||||||||||||||||||||||||||||||||||||||||||||||||||||||||||||||||||||||||||||||||||||||||||||||||||||||||||||||||||||||||||||||||||||||||||||||||||||||||||||||||||||||||||||||||||||||||||||||||||||||||||||||||||||||||||||||||||||||||||||||||||||||||||||||||||||||||||||||||||||||||||||||||||||||||||||||||||||||||||||||||||||||||||||||||||||||||||||||||||||||||||||||||||||||||||||||||||||
| Transfer rate | Not Available: The Languages and Literature division is currently working on coming up with a template of a form that our graduates will be filling in to help keep track of the movement of our graduates. Collaboration with the office of Admissions and Records is also needed to help identify students who transfer (via transcript requests) and also to identify Liberal Arts students who further their studies here at the college by pursuing second degrees and enrolling in third-year programs. | |||||||||||||||||||||||||||||||||||||||||||||||||||||||||||||||||||||||||||||||||||||||||||||||||||||||||||||||||||||||||||||||||||||||||||||||||||||||||||||||||||||||||||||||||||||||||||||||||||||||||||||||||||||||||||||||||||||||||||||||||||||||||||||||||||||||||||||||||||||||||||||||||||||||||||||||||||||||||||||||||||||||||||||||||||||||||||||||||||||||||||||||||||||||||||||||||||||||||||||||||||||||||||||||||||||||||||||||||||||||||||||||||||||||||||||||||||||||||||||||||||||||||||||||||
| Analysis | ||||||||||||||||||||||||||||||||||||||||||||||||||||||||||||||||||||||||||||||||||||||||||||||||||||||||||||||||||||||||||||||||||||||||||||||||||||||||||||||||||||||||||||||||||||||||||||||||||||||||||||||||||||||||||||||||||||||||||||||||||||||||||||||||||||||||||||||||||||||||||||||||||||||||||||||||||||||||||||||||||||||||||||||||||||||||||||||||||||||||||||||||||||||||||||||||||||||||||||||||||||||||||||||||||||||||||||||||||||||||||||||||||||||||||||||||||||||||||||||||||||||||||||||||||
Findings This section provides discussion of information discovered as a result of the evaluation such as problems or concerns with the program and what part of the program is working well and meeting expectation. |
The data that was most disappointing was the low graduation rates of the Liberal Arts students and this review showed that more needs to be done in assisting our students so that they can graduate at the 100% time range and not longer. The low completion rates in some specific classes is also an area of concern since students need to pass the courses before they can take other courses and if they are not successfully completing their core requirements, then everything else will be delayed leading to the low graduation rate of our program participants. There are some specific classes that students seem to be consistently performing poorly in as well so maybe teacher development is also an area that the program needs to work on as well as tutoring and additional support for those specific classes. |
|||||||||||||||||||||||||||||||||||||||||||||||||||||||||||||||||||||||||||||||||||||||||||||||||||||||||||||||||||||||||||||||||||||||||||||||||||||||||||||||||||||||||||||||||||||||||||||||||||||||||||||||||||||||||||||||||||||||||||||||||||||||||||||||||||||||||||||||||||||||||||||||||||||||||||||||||||||||||||||||||||||||||||||||||||||||||||||||||||||||||||||||||||||||||||||||||||||||||||||||||||||||||||||||||||||||||||||||||||||||||||||||||||||||||||||||||||||||||||||||||||||||||||||||||
Recommendations This section provides recommendations from the program on what to do to improve or enhance the quality of program and course learning outcomes as well as program goals and objectives. This section should also include suggestions that describe how the program might be able to create opportunities for a better program in the future. Some examples are exploring alternate delivery mechanisms, forming external partnerships, or realigning with other programs. |
One of the most common recommendations from program faculty on their course level assessments is the need for the program to review our course pre-requisites as most of the faculty feel that the pre-requisites are necessary as they help build skill and knowledge that the students will need in order to be successful in all of their core requirement courses as well as their electives. Because of this, the program faculty will continue to review and recommend pre-requisites for all of our core classes as we review course outlines. Another recommendation is to help provide information on the kinds of options that students have upon graduating with a degree in Liberal Arts. Because most students don’t know what they can do after earning a Liberal Arts degree, they tend not to do much planning or preparation for paths that they can take upon graduating from COM-FSM. The Liberal Arts program faculty will be working with cohort groups in the upcoming assessment cycle to ensure that they have a solid idea and have plans on what they will be pursuing upon graduation. Workshops with IOM and other college staff is in the works so that they can help to prepare our graduates as most students felt that they would be transferring or pursuing higher degrees as the next step after graduation. |
|||||||||||||||||||||||||||||||||||||||||||||||||||||||||||||||||||||||||||||||||||||||||||||||||||||||||||||||||||||||||||||||||||||||||||||||||||||||||||||||||||||||||||||||||||||||||||||||||||||||||||||||||||||||||||||||||||||||||||||||||||||||||||||||||||||||||||||||||||||||||||||||||||||||||||||||||||||||||||||||||||||||||||||||||||||||||||||||||||||||||||||||||||||||||||||||||||||||||||||||||||||||||||||||||||||||||||||||||||||||||||||||||||||||||||||||||||||||||||||||||||||||||||||||||
This website and all COM-FSM Internet based services are best viewed with Firefox 3.0 or better.
© Copyright 2026 College of Micronesia-FSM | Site Disclaimer
P. O. Box 159, Kolonia, Pohnpei, 96941 - (691) 320-2480
College of Micronesia-FSM is accredited by the Accrediting Commission for Community and Junior Colleges,
Western Association of Schools and Colleges, 428 J Street., Suite 400 Sacramento, CA 95814, (415) 506-0234,
an institutional accrediting body recognized by the Council for Higher Education Accreditation and the U.S. Department of Education.
Additional information about accreditation, including the filing of complaints against member institutions, can be found at: www.accjc.org