- Our College
- Academics
- Student Services
- Public Reports
- Forum
- Library
- Quick Access
AP Full Official: Liberal Arts
Campus: National Campus
Completed by: Resida S. Keller, Language & Literature Division Chairperson
AP Review Submission Date: April 4, 2014
AR Review Cycle: AY 2012-2013
Program goals are broad statements concerning knowledge, skills, or values that the faculty members expect the graduating students to achieve.
Upon successful completion of this degree program, students will be able to:
Provide basic knowledge of human biological sciences in preparation for a career in health.
This section describes the history of the program. This includes the date and reason of implementation, significant milestones in the development of the program, and significant current activities.
The Associate of Arts degree program in Liberal Arts was established in 1975 to enable students to transfer to a four-year college, university, or other institution. Other than the addition and establishment of more focused and area-specific liberal arts degrees such as the Liberal Arts/Media studies and the Liberal Arts/Education programs (adopted in 1997) or the Liberal Arts/HCOP [Health Careers Opportunities Program], there have been no major changes to the structure of the Liberal Arts program in the past 10 years. The program learning outcomes (above) for the L.A. Degree program were adopted in Spring 2005.
The program description describes the program, including its organization, relationship to other programs in the system, program design, degree(s) offered, and other significant features of the program, such as elements/resources for forward-looking new program contributions to the state’s economy, or specialized program accreditation.
This section describes the requirements for admission into the program and other requisites.
All students accepted for admission into the college are eligible to enter/major in the Liberal Arts program. Currently, students undecided on a major are also listed as Liberal Arts majors until they decide otherwise. The college’s admissions criteria as listed in the college website at http://www.comfsm.fm/publications/catalog-2013- 2014/requirements.pdf. is followed when admitting students into this program.
This section specifies the requirements for obtaining a certificate/degree in the program, including specific courses,, sequencing of courses, total credits, internships, practical, etc.
The Liberal Arts program as it currently stands consists of General Education Core Requirements in English [9 credits], Natural Sciences [7 credits], Mathematics, Social Sciences, Computer Applications and Humanities [each 3 credits], and Exercise Sports Science [1 credit].
In addition to General Education core requirements, there are the Major Requirements which include the following courses: three credits for each of these courses---Speech Communication (EN/CO 205), Health Science (SC 101), Introduction to Sociology (SS 130), General Psychology (SS/PY 101); three credits each of a 200- levelEnglish course and Humanities elective, six credits of any classes from either the Natural Science or Social Science group of courses and nine credits of open electives, totaling up to sixty-two credits (62) required for an Associate’s degree.
Currently students are encouraged to follow a specified sequence of courses so that they are able to complete the
program within two years.
Here is the suggested sequence of Liberal Arts courses as it currently stands in the college catalog:
Source: General Catalog 2013-2014 pg. 23
http://www.comfsm.fm/publications/catalog-2013-2014/requirements.pdf
As is apparent in the list of courses required for the program, students in the program are not required to
complete any internships, field experiences, practicums or licensing as this is a program that encourages exploration into a general course of study to help students transfer to other institutions or to further learn about different fields of study.
This section lists courses offered in the program, including number of sections, course enrollment, section fill rates, and redundancy of courses across the institution.
LIBERAL ARTS COURSE OFFERINGS (MAJOR COURSE REQUIREMENTS)COURSE NAME |
Total Enrollment |
# of Sections |
Class Size/Course |
|||
Program Course Requirements |
SP 12 |
Fall 2012 |
Sp 12 |
Fall 12 |
Sp 12 |
Fall 12 |
EN/CO 205 Speec Comm. |
198 |
123 |
10 |
6 |
20 |
19 |
SC 101 Health Science |
180 |
176 |
9 |
8 |
20 |
19 |
SS 130 Intro. to Sociology |
91 |
73 |
4 |
3 |
20 |
19 |
SS/PY General Psychology |
168 |
107 |
8 |
5 |
20 |
19 |
200-Level English Elective |
||||||
EN 201 Intro to Literature |
108 |
83 |
5 |
4 |
20 |
19 |
EN 203 Drama |
0 |
0 |
0 |
0 |
20 |
19 |
EN 204 Poetry |
0 |
0 |
0 |
0 |
20 |
19 |
EN 208 Intro to Philosophy |
116 |
95 |
5 |
4 |
20 |
19 |
EN 209 Intro to Religion |
20 |
20 |
1 |
1 |
20 |
19 |
Humanities Elective |
||||||
AR 101 Intro to Art |
87 |
51 |
4 |
2 |
20 |
19 |
MU 101 Intro to Music |
80 |
0 |
4 |
0 |
20 |
19 |
SS 170 History I |
52 |
88 |
2 |
4 |
20 |
19 |
SS 171 History II |
52 |
28 |
2 |
1 |
20 |
19 |
EN 201 Intro to Literature |
108 |
83 |
5 |
4 |
20 |
19 |
EN 208 Intro to Philosophy |
116 |
95 |
5 |
4 |
20 |
19 |
FL 101 Japanese I |
104 |
92 |
5 |
5 |
20 |
19 |
FL 102 Japanese II |
14 |
0 |
1 |
0 |
20 |
19 |
FL 103 Chinese I |
41 |
60 |
2 |
3 |
20 |
19 |
FL 104 Chinese II |
0 |
0 |
0 |
0 |
20 |
19 |
This section reports the faculty of the program, including full-time and part-time faculty. The degrees held and rank are provided for the full-time and part-time faculty. Finally, provide the faculty student ratio for the program.
The program faculty consists of faculty members from the different academic divisions of the college. The Liberal Arts program is taught by a unique mix of the college’s existing faculty members as the program requirements consist of courses that come from many of the different divisions of the college. The Languages and Literature Division faculty, for the most part, act as advisors and teachers to the students who choose Liberal Arts as their major.
Here is a list of the current faculty members of the Liberal Arts program:
This section provides the data for analyzing the extent to which the program has achieved the established outcomes and criteria. This is the most important part of the program review. The data that will be collected and evaluated are the following:
| Spring 2012 | ||||||||
| Course | Instructor | A | B | C | D | F | Withdrawal | recommendations/Comments |
| EN 208 Philosophy | Christopher Ross Perkins | 4 | 9 | 6 | 6 | 10 | 4 | 4 of the 5 "F" were due to violating the attendance policy in the class, hence the importance of attendance to passing the class. |
| EN 209 Religion | Christopher Ross Perkins | 3 | 2 | 3 | 3 | 6 | 3 | none |
| EN 201 Literature | Monica Rivera | 12 | 6 | 2 | 1 | 1 | 0 | Students cooperated well in group assignments for the short story discussions and the drama assignments. |
| EN 204 Poetry | John Ranahan | 1 | 8 | 5 | 1 | 1 | 0 | None |
| EN/CO 205 | Amy Delyla Ulm | 9 | 11 | 12 | 5 | 4 | 0 | Passing EN 120 A with a grade of C or higher should be a required prerequisite for this course. |
| Fall 2012 | ||||||||
| Course | Instructor | A | B | C | D | F | Withdrawal | recommendations/Comments |
| EN 208 Philosophy | Christopher Ross Perkins | 2 | 6 | 6 | 2 | 4 | 1 | all "F" were due to attendance; there was a 46% difference in the averages from the pre to the post test (pre-test averages: 15%; post-test average: 61% |
| EN 209 Religion | Christopher Ross Perkins | 2 | 2 | 5 | 7 | 1 | 2 | |
| EN 201 Literature | John Ranahan | 4 | 9 | 16 | 10 | 3 | 0 | The majority of students struggled with the basic elements of the literary genres |
| EN 204 Poetry | Not offered | |||||||
| EN/CO 205 | Amy Delyla Ulm | 6 | 10 | 4 | 0 | 2 | * Class was taken over mid-semester when initial instructor left--students had to pick up with new instructor where they left off. Most assessments was based on this latter instructor's evaluations. | |
| FL 101 | Akiko Kamikubo | 1 | 9 | 1 | 2 | 2 | 0 | Hiragana workbook was useful in helping students with reading and writing. The workbook should be checked more frequently and strictly especially for slow- learners. |
| Spring 2013 | ||||||||
| Course | Instructor | A | B | C | D | F | Withdrawal | recommendations/Comments |
| EN 208 Philosophy | Christopher Ross Perkins | |||||||
| EN 209 Religion | ||||||||
| EN 201 Literature | *working to fix electronic copies that were submitted-file got corrupted so data will be available at a later date. | |||||||
| EN 204 Poetry | ||||||||
| EN/CO 205 | ||||||||
| FL 101 Japanese I | ||||||||
| Spring 2013 | ||||||||
| Course | Instructor | A | B | C | D | F | Withdrawal | recommendations/Comments |
| EN 208 Philosophy | Kasiano Paul | 16 | 13 | 12 | 0 | 3 | 1 | Presentations and class discussions were methods that worked well with the students. |
| EN 209 Religion | Kasiano Paul | 4 | 3 | 10 | 1 | 1 | 1 | Students demonstrated unfamiliarity with the major religions discussed in class, thus hindering understanding of course content. |
| EN 201 Literature | Monica Rivera | 9 | 6 | 7 | 1 | 2 | 0 | By mid-term, most students who were passing (A,b and C--52%) either maintained their performance or improved showing a 48% of the students earning an 'A' in the class. |
| EN 204 Poetry | ||||||||
| EN/CO 205 | Christina Madison | 1 | 2 | 8 | 1 | 0 | 0 | Passing EN 120a with a C or higher should be a pre-requisite for this class. |
| FL 101 Japanese I | Akiko Kamikubo | 8 | 10 | 4 | 1 | 1 | 0 | Hiragana workbook was not bound well and had missing pages--note to inform the bookstore as this book is essential for student practice. |
| ART 101 | Christina Madison | 5 | 5 | 2 | 1 | 0 | 7 | Due to cultural and historical contexts, the reading in the text was difficult for students to connect to; because most students taking this class were freshmen, many dropped out due to the intensive reading and homework which they were not used to coming straight from high school. |
All assessments of courses offered under the Liberal Arts program for the Fall/Spring 2012 and Fall/Spring 2013 semesters can be found at the following link:
http://wiki.comfsm.fm/Programs/Liberal_Arts
For the 2012-2013 assessment of the Liberal Arts program learning outcomes, the PSLO #2 which states “Articulate and understand their experiences through effective writing, reading, speaking, and various modes of artistic expression” was the outcome that the division focused on during this assessment cycle.
The Liberal Arts Program assessment focused on PSLO 2. Listed below are the results for the PSLO 2.
What we found:
Multiple sections (8 sections total) of the four courses assessed were EN 201 [Intro. To Literature], EN 205 [Speech Communication], EN 208 [Intro. To Religion] and EN 209 [Intro. To Philosophy]. A sample of 120 students was assessed using a modified COMET rubric that assessed students in four areas (coherence, content, format and conventions). 86% of the students in all the 200-level English courses assessed performed above average for Coherence (4 out of 4 courses performed above the set satisfactory rate of 70% which is the minimum for passing). Students in 3 out of the 4 courses performed above average on content (50%, 73%, 78% and 86%). Students in 3 out of 4 courses performed above average on Format (64%, 74%, 81%, and 86%). Students in 2 out of 3 courses performed above average on Conventions (64%, 84%, and 95%). The students in the fourth course (Speech Communication) were not assessed on the conventions criteria.
More information on the Liberal Arts program Assessment plans, activities and results can be retrieved and reviewed at the following link: http://www.comfsm.fm/?q=Liberal-Arts-Program
LIBERAL ARTS PROGRAM ENROLLMENT DATA
(SPRING 2012-FALL 2013)
Major Description |
Degree |
Chuuk |
Kosrae |
National |
Pohnpei |
Yap |
Students |
Liberal Arts |
AA |
|
63 |
165 |
48 |
42 |
318 |
Major Description |
Degree |
Chuuk |
Kosrae |
National |
Pohnpei |
Yap |
College |
% |
Liberal Arts |
AA |
|
59 |
188 |
44 |
33 |
324 |
11.80% |
Major Description |
Degree |
Chuuk |
Kosrae |
National |
Pohnpei |
Yap |
Student |
Liberal Arts |
AA |
2 |
42 |
152 |
28 |
25 |
249 |
Major Description |
Degree |
Chuuk |
Kosrae |
National |
Pohnpei |
Yap |
College |
% |
Liberal Arts |
AA |
1 |
38 |
169 |
37 |
23 |
268 |
% |
Major Description |
Degree |
Term |
Chuuk |
Kosrae |
National |
Pohnpei |
Yap |
Student |
Liberal Arts |
AA |
Fall 2011 |
|
74 |
191 |
73 |
43 |
381 |
Liberal Arts |
AA |
Fall 2012 |
|
56 |
190 |
43 |
32 |
321 |
Liberal Arts |
AA |
Fall 2013 |
1 |
37 |
170 |
36 |
23 |
267 |
Liberal Arts |
AA |
Spring 2011 |
|
31 |
179 |
48 |
29 |
287 |
Liberal Arts |
AA |
Spring 2012 |
|
63 |
163 |
48 |
42 |
316 |
Liberal Arts |
AA |
Spring 2013 |
2 |
43 |
151 |
27 |
26 |
249 |
This set of data further confirms the downward decline in enrollment in the major. The enrollment figures show a drastic drop in enrollment at the state campuses between the Fall and the Spring semesters. This drop in enrollment could be due to students transferring to the National campus and changing their majors as many undecided majors are by default, counted as Liberal Arts majors.
Program |
Term |
Section |
EnrollMax |
Enrollment |
EnrollRatio |
Average Class Size |
Liberal Arts (AA) |
Fall 2011 |
24 |
602 |
551 |
91.5% |
23.0 |
Liberal Arts (AA) |
Fall 2012 |
23 |
581 |
467 |
80.4% |
20.30 |
Liberal Arts (AA) |
Fall 2013 |
24 |
601 |
443 |
73.7% |
18.5 |
Liberal Arts (AA) |
Spring 2011 |
25 |
643 |
555 |
86.3% |
22.2 |
Liberal Arts (AA) |
Spring 2012 |
30 |
765 |
645 |
84.3% |
21.5 |
Liberal Arts (AA) |
Spring 2013 |
26 |
619 |
458 |
74.0% |
17.6 |
The data shows that there are more sections offered during the Spring semester than the Fall semester, that actual enrollment in courses within the program did not fall below 400+ students during this assessment cycle and that class sizes dropped with Fall and Spring 2011 having the highest class size and Fall and Spring 2013 seeing a drop in class size of about 5 students in the Fall and 1 student in the Spring. Enrollment numbers have dropped since the beginning of the assessment cycle in 2012 and have steadily followed a downward trend or decline since 2011.
Subject Description |
Course Number |
Term |
Students |
ABC or P% |
ABCD or P% |
W% |
English |
201 |
Fall 2011 |
93 |
73.10% |
89.20% |
3.20% |
English |
201 |
Fall 2012 |
83 |
67.50% |
86.70% |
6.00% |
English |
201 |
Fall 2013 |
83 |
75.90% |
86.70% |
2.40% |
English |
201 |
Spring 2011 |
80 |
77.50% |
86.30% |
6.30% |
English |
201 |
Spring 2012 |
108 |
74.10% |
86.10% |
7.40% |
English |
201 |
Spring 2013 |
98 |
78.60% |
84.70% |
3.10% |
|
||||||
English |
205 |
Fall 2013 |
25 |
40.0% |
52.00% |
8.00% |
English |
205 |
Spring 2012 |
31 |
71.00% |
93.5% |
0.00% |
English |
205 |
Spring 2013 |
29 |
89.7% |
96.6% |
3.40% |
|
||||||
English |
208 |
Fall 2011 |
116 |
69.00% |
79.3% |
4.30% |
English |
208 |
Fall 2012 |
95 |
63.2% |
69.5% |
2.1% |
English |
208 |
Fall 2013 |
81 |
84.0% |
87.7% |
6.2% |
English |
208 |
Spring 2011 |
121 |
67.80% |
75.2% |
14.9% |
English |
208 |
Spring 2012 |
116 |
70.7% |
81.9% |
6.0% |
English |
208 |
Spring 2013 |
97 |
61.9% |
67.0% |
20.6% |
|
||||||
English |
209 |
Fall 2012 |
20 |
45.0% |
80.0% |
15.0% |
English |
209 |
Fall 2013 |
21 |
81.0% |
90.5% |
4.8% |
English |
209 |
Spring 2012 |
20 |
40.0% |
55.0% |
15.0% |
English |
209 |
Spring 2013 |
19 |
68.4% |
73.7% |
26.3% |
|
||||||
Art |
101 |
Fall 2011 |
62 |
90.3% |
96.8% |
1.60% |
Art |
101 |
Fall 2012 |
51 |
76.5% |
78.4% |
3.90% |
Art |
101 |
Fall 2013 |
66 |
57.6% |
75.8% |
13.60% |
Art |
101 |
Spring 2012 |
87 |
69.0% |
74.7% |
16.10% |
Art |
101 |
Spring 2013 |
141 |
61.70% |
68.1% |
14.90% |
|
||||||
Foreign Languages |
101 |
Fall 2012 |
92 |
60.9% |
80.70% |
4.50% |
Foreign Languages |
101 |
Fall 2013 |
67 |
79.1% |
75.00% |
14.10% |
Foreign Languages |
101 |
Spring 2011 |
72 |
76.4% |
80.60% |
10.40% |
Foreign Languages |
101 |
Spring 2012 |
104 |
63.5% |
90.30% |
0.00% |
Foreign Languages |
101 |
Spring 2013 |
76 |
71.1% |
75.00% |
11.5% |
|
||||||
Foreign Languages |
102 |
Fall 2011 |
21 |
71.4% |
71.4% |
4.80% |
Foreign Languages |
102 |
Spring 2011 |
21 |
71.4% |
76.20% |
4.80% |
Foreign Languages |
102 |
Spring 2012 |
14 |
78.6% |
85.7% |
0.00% |
Foreign Languages |
102 |
Spring 2013 |
16 |
75.00% |
75.00% |
18.80% |
|
||||||
Foreign Languages |
103 |
Fall 2011 |
28 |
64.3% |
82.1% |
17.90% |
Foreign Languages |
103 |
Fall 2012 |
60 |
88.3% |
90.00% |
10.00% |
Foreign Languages |
103 |
Fall 2013 |
68 |
69.10% |
86.60% |
11.80% |
Foreign Languages |
103 |
Spring 2011 |
48 |
81.3% |
89.60% |
10.40% |
Foreign Languages |
103 |
Spring 2012 |
41 |
85.4% |
100.00% |
0.00% |
Foreign Languages |
103 |
Spring 2013 |
44 |
86.4% |
93.20% |
6.80% |
|
||||||
General Psychology |
101 |
Fall 2013 |
28 |
|
75.00% |
21.40% |
General Psychology |
101 |
Fall 2011 |
166 |
65.10% |
85.50% |
5.40% |
General Psychology |
101 |
Fall 2012 |
107 |
71.00% |
83.20% |
4.70% |
General Psychology |
101 |
Fall 2013 |
98 |
66.30% |
84.70% |
7.10% |
General Psychology |
101 |
Spring 2011 |
159 |
57.2% |
77.40% |
3.10% |
General Psychology |
101 |
Spring 2012 |
168 |
66.7% |
81.5% |
7.10% |
General Psychology |
101 |
Spring 2013 |
133 |
61.7% |
75.20% |
7.50% |
|
||||||
Social Science |
130 |
Fall 2011 |
54 |
64.8% |
79.6% |
5.6% |
Social Science |
130 |
Fall 2012 |
73 |
56.2% |
72.6% |
13.7% |
Social Science |
130 |
Fall 2013 |
59 |
49.2% |
66.1% |
25.4% |
Social Science |
130 |
Spring 2011 |
70 |
78.60% |
84.3% |
4.30% |
Social Science |
130 |
Spring 2012 |
91 |
63.7% |
70.30% |
8.80% |
Social Science |
130 |
Spring 2013 |
66 |
48.5% |
62.1% |
22.7% |
|
||||||
Social Science |
170 |
Fall 2012 |
88 |
31.8% |
76.5% |
2.5% |
Social Science |
170 |
Fall 2013 |
98 |
93.9% |
54.5% |
2.30% |
Social Science |
170 |
Spring 2011 |
208 |
68.3% |
95.9% |
0.00% |
Social Science |
170 |
Spring 2012 |
52 |
42.3% |
74.00% |
5.8% |
Social Science |
170 |
Spring 2013 |
42 |
71.4% |
53.8% |
11.5% |
|
||||||
Social Science |
171 |
Fall 2012 |
28 |
85.7% |
89.3% |
7.10% |
Social Science |
171 |
Spring 2012 |
52 |
63.5% |
75.00% |
9.60% |
Social Science |
171 |
Spring 2013 |
25 |
84.00% |
84.00% |
4.00% |
|
||||||
Science |
101 |
Fall 2011 |
230 |
58.30% |
68.70% |
8.30% |
Science |
101 |
Fall 2012 |
176 |
63.10% |
75.00% |
2.30% |
Science |
101 |
Fall 2013 |
155 |
48.4% |
69.00% |
11.60% |
Science |
101 |
Spring 2011 |
179 |
52.50% |
62.00% |
16.20% |
Science |
101 |
Spring 2012 |
180 |
33.30% |
47.20% |
23.90% |
Science |
101 |
Spring 2013 |
158 |
27.80% |
38.6% |
25.90% |
|
||||||
Music |
101 |
Fall 2011 |
84 |
66.70% |
70.20% |
17.90% |
Music |
101 |
Fall 2013 |
41 |
90.20% |
92.70% |
7.30% |
Music |
101 |
Spring 2011 |
129 |
61.2% |
65.1% |
17.1% |
Music |
101 |
Spring 2012 |
80 |
63.8% |
65.00% |
21.3% |
|
||||||
Speech Communication |
205 |
Fall 2011 |
159 |
63.5% |
71.7% |
10.70% |
Speech Communication |
205 |
Fall 2012 |
123 |
71.50% |
78.00% |
7.30% |
Speech Communication |
205 |
Fall 2013 |
95 |
64.2% |
74.70% |
5.30% |
Speech Communication |
205 |
Spring 2011 |
169 |
69.2% |
81.10% |
7.10% |
Speech Communication |
205 |
Spring 2012 |
167 |
64.7% |
71.3% |
16.20% |
Speech Communication |
205 |
Spring 2013 |
109 |
43.1% |
51.4% |
36.70% |
Completion rates show that overall rates were higher during the spring semesters as compared to the Fall semesters. The lowest passing rate was in the Health Science course with a rate of 27.8% while the Humanities courses boasted the highest passing rates with student passing rates for the foreign languages, history, music and arts classes ranging from the high 70s to 100% passing rates consistently across the board. Social science courses had the next highest passing rates, followed by English classes and the natural science courses.
Major |
Degree |
New Stdnts |
Students 2012_1 |
Students 2012_3 |
Persistence |
Retention Fall 2012 |
Liberal Arts |
AA |
73 |
60 |
35 |
82.2% |
47.9% |
Major |
Degree |
New FT |
Persisted |
Retained |
Persistence |
Retention Fall 2013 |
Liberal Arts |
AA |
62 |
49 |
32 |
79.0% |
51.6% |
The data shows that persistence rates during the Spring 2012 and Spring 2013 semesters dropped 3.2% although overall the persistence rates were pretty high running in the 80 to 70 percent rates.
The retention rate from Fall 2012 to Fall 2013 remained steady with a slight increase of 3.7% (see table above)
Not Applicable—Liberal Arts students are not required to take any exams for licensing or certification.
Major |
Degree |
Enrollment |
AY2011/12 |
AY2012/13 |
Graduates |
GradRate100% |
GradRate150% |
Liberal Arts |
AA |
77 |
1 |
10 |
11 |
1.3% |
14.3% |
Major |
Degree |
AY2010/11 |
AY2011/12 |
AY2012/13 |
Liberal Arts |
AA |
67 |
46 |
61 |
Based on the above data, during this assessment cycle, only 1.3% of the Liberal Arts graduates were able to complete the program within two years. Within three years, the rate increased by 13% resulting in a graduation rate of 14.3%. This shows that very few students are able to complete the program in the allotted two year period. When given a little bit more time to complete over the two year period, nine times more students were able to complete the program. The low graduation rates has propelled the Languages and Literature division into reviewing the credit requirements, the suggested course schedule that students follow (there is no room for failure or make-up and typically for some courses, students need more time as they do repeat courses) course pre-requisites and the program courses’ connection to other programs.
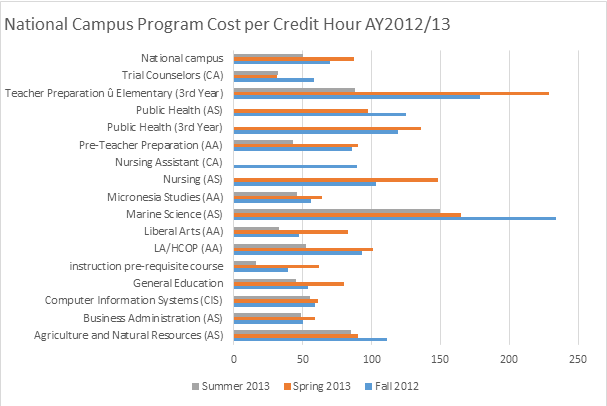
Program |
Fall 2012 |
Spring 2013 |
Summer 2013 |
Liberal Arts (AA) |
47 |
83 |
33 |
*data provided by IRPO
The cost of running the Liberal Arts program when compared to other programs is fairly low and despite servicing a large number of students, is consistent and is not considered to be a high cost program. Costs are higher in the Spring than the Fall and Summer, mainly due to the higher number of courses that are offered in Spring based on student need. The persistence rate from Fall the Spring is higher, indicating that many students in the program continue from Fall to Spring yet do not necessarily continue in the following Summer or Fall semesters thus contributing to the low retention rates. High persistence from Fall to Spring is reflected in the higher cost of running the program in Spring than Fall.
Not Applicable
Answer Options |
Strongly Agree |
Agree |
Disagree |
Strongly Disagree |
Response Count |
1. Faculty care about me as an individual. |
9 |
24 |
4 |
1 |
38 |
2. My academic advisor is approachable. |
18 |
19 |
1 |
0 |
38 |
3. Classes are scheduled at times that are convenient for |
8 |
22 |
7 |
1 |
38 |
4. Internships or practical experiences are provided in my |
8 |
21 |
8 |
1 |
38 |
5. My academic advisor helps me set goals to work |
14 |
21 |
2 |
0 |
37 |
6. Library resources and services are adequate. |
16 |
17 |
4 |
1 |
38 |
7. I am able to register for classes I need with few |
9 |
22 |
6 |
1 |
38 |
8. The quality of instruction I receive in most of my |
9 |
26 |
3 |
0 |
38 |
9. Faculty are understanding of students' unique life |
4 |
22 |
12 |
0 |
38 |
10. My academic advisor is concerned about my success |
10 |
27 |
1 |
0 |
38 |
11. It is an enjoyable experience to be a student on this |
18 |
18 |
1 |
1 |
38 |
12. Faculty are fair and unbiased in their treatment of |
9 |
22 |
6 |
1 |
38 |
13. My academic advisor is knowledgeable about my |
14 |
23 |
1 |
0 |
38 |
14. Students are made to feel welcome on this campus. |
15 |
20 |
2 |
1 |
38 |
15. Faculty take into consideration student differences as |
11 |
22 |
5 |
0 |
38 |
16. My academic advisor is knowledgeable about the |
11 |
23 |
4 |
0 |
38 |
17. The equipment in the lab facilities is kept up to date. |
4 |
25 |
7 |
2 |
38 |
18. Class change (drop/add) policies are reasonable. |
12 |
20 |
4 |
0 |
38 |
19. I generally know what's happening on campus. |
9 |
18 |
9 |
2 |
38 |
20. Faculty provide timely feedback about student |
14 |
17 |
7 |
0 |
38 |
21. Tutoring services are readily available. |
14 |
16 |
8 |
0 |
38 |
22. This school does whatever it can to help me reach |
14 |
17 |
6 |
1 |
38 |
23. The assessment and course placement procedures |
13 |
20 |
4 |
1 |
38 |
24. Faculty are interested in my academic problems. |
8 |
20 |
8 |
2 |
38 |
25. Nearly all of the faculty are knowledgeable in their |
11 |
17 |
5 |
2 |
35 |
26. Faculty are usually available after class and during |
10 |
22 |
4 |
0 |
36 |
27. Nearly all classes deal with practical experiences and |
8 |
21 |
8 |
0 |
37 |
28. Students are notified early in the term if they are |
12 |
20 |
6 |
0 |
38 |
29. Program requirements are clear and reasonable. |
13 |
20 |
4 |
1 |
38 |
30. There is a good variety of courses suitable for my |
15 |
20 |
2 |
1 |
38 |
31. I am able to experience intellectual growth here. |
10 |
26 |
2 |
0 |
38 |
32. The campus faculty/staff are caring and helpful. |
8 |
26 |
3 |
1 |
38 |
33. My academic advisor is available when I need help. |
15 |
20 |
3 |
0 |
38 |
34. I am able to register for classes I need with few |
11 |
18 |
7 |
1 |
37 |
35. My advisor helps me apply my program of study to |
12 |
24 |
2 |
0 |
38 |
36. Computer labs are adequate and accessible. |
12 |
15 |
7 |
3 |
37 |
The questions in which students who were surveyed expressed the highest dissatisfaction were on the following questions:
Not Available
Not Available
Not Available
Not Available: The Languages and Literature division is currently working on coming up with a template of a form that our graduates will be filling in to help keep track of the movement of our graduates. Collaboration with the office of Admissions and Records is also needed to help identify students who transfer (via transcript requests) and also to identify Liberal Arts students who further their studies here at the college by pursuing second degrees and enrolling in third-year programs.
Findings |
|
Recommendations |
|
This website and all COM-FSM Internet based services are best viewed with Firefox 3.0 or better.
© Copyright 2026 College of Micronesia-FSM | Site Disclaimer
P. O. Box 159, Kolonia, Pohnpei, 96941 - (691) 320-2480
College of Micronesia-FSM is accredited by the Accrediting Commission for Community and Junior Colleges,
Western Association of Schools and Colleges, 428 J Street., Suite 400 Sacramento, CA 95814, (415) 506-0234,
an institutional accrediting body recognized by the Council for Higher Education Accreditation and the U.S. Department of Education.
Additional information about accreditation, including the filing of complaints against member institutions, can be found at: www.accjc.org