- Our College
- Academics
- Student Services
- Public Reports
- Forum
- Library
- Quick Access
GENERAL INFORMATION:
|
Course title: MS 150 Statistics |
||
|
Campus: National |
Initiator: Dana Lee Ling |
Date: 16 May 2018 |
|
Course description A one semester course designed as an introduction to the basic ideas of data presentation, descriptive statistics, linear regression, and inferential statistics including confidence intervals and hypothesis testing. Basic concepts are studied using applications from health, education, business, social science, and the natural sciences. The course uses spreadsheet software for both data analysis and presentation. The course includes a focus on the use of computing technologies for statistical problem solving. |
||
COURSE HOURS/CREDITS:
Hours per Week |
|
No. of Weeks |
|
Total Hours |
|
Semester Credits |
||||
|
Lecture |
3 |
x |
16 |
x |
48 |
= |
3 |
|||
|
Laboratory |
x |
x |
= |
|||||||
|
Workshop |
x |
x |
= |
|||||||
|
Total Semester |
Credits |
3 |
||||||||
PURPOSE OF COURSE:
[ X ] Degree requirement
[ X ] Degree elective
[ ] Certificate
[ ] Other
PREREQUISITES: ESL 089 and passing any 100 level or higher mathematics course.
PSLOS OF OTHER PROGRAMS THIS COURSE MEETS:
|
PSLO# |
Program |
|
GE 3.1 |
Demonstrate understanding and apply mathematical concepts in problem solving and in day to day activities. |
|
GE 3.2 |
Present and interpret numeric information in graphic forms. |
1) INSTITUTIONAL STUDENT LEARNING OUTCOMES (Check all that apply)
|
[ ] |
1. Effective oral communication: capacity to deliver prepared, purposeful presentations designed to increase knowledge, to foster understanding, or to promote change in the listeners’ attitudes, values, beliefs, or behaviors. |
|
[ ] |
2. Effective written communication: development and expression of ideas in writing through work in many genres and styles, utilizing different writing technologies, and mixing texts, data, and images through iterative experiences across the curriculum. |
|
[ ] |
3. Critical thinking: a habit of mind characterized by the comprehensive exploration of issues, ideas, artifacts, and events before accepting or formulating an opinion or conclusion. |
|
[ ] |
4. Problem solving: capacity to design, evaluate, and implement a strategy to answer an open-ended question or achieve a desired goal. |
|
[ ] |
5. Intercultural knowledge and competence: a set of cognitive, affective, and behavioral skills and characteristics that support effective and appropriate interaction in a variety of cultural contexts. |
|
[ ] |
6. Information literacy: the ability to know when there is a need for information, to be able to identify, locate, evaluate, and effectively and responsibly use and share that information for the problem at hand. |
|
[ ] |
7. Foundations and skills for life-long learning : purposeful learning activity, undertaken on an ongoing basis with the aim of improving knowledge, skills, and competence. |
|
[X] |
8. Quantitative Reasoning: ability to reason and solve quantitative problems from a wide array of authentic contexts and everyday life situations; comprehends and can create sophisticated arguments supported by quantitative evidence and can clearly communicate those arguments in a variety of formats. |
2) PROGRAM STUDENT LEARNING OUTCOMES (PSLOs): The student will be able
to:
GE 3.1 Demonstrate understanding and apply mathematical concepts in problem solving and in day to day activities.
GE 3.2 Present and interpret numeric information in graphic forms.
3) COURSE STUDENT LEARNING OUTCOMES (CSLOs) (General): The student will be
able to:
1. Perform basic statistical calculations for a single variable up to and including graphical analysis, confidence intervals, hypothesis testing against an expected value, and testing two samples for a difference of means.
2. Perform basic statistical calculations for paired correlated variables.
3. Engage in data exploration and analysis using appropriate statistical techniques including numeric calculations, graphical approaches, and tests.
4. COURSE STUDENT LEARNING OUTCOMES (CSLOs) (Specific): The student will be
able to:
5) COURSE CONTENT:
1. Populations and samples
2. Measures of middle and spread
3. Visualizing data
4. Paired data and scatter diagrams
5. Probability
6. Normal distribution
7. Standard error
8. Confidence intervals for the mean
9. Hypothesis testing against a known population mean
10. Hypothesis testing two sample means
11. Data exploration
6) METHOD(S) OF INSTRUCTION:
[ X ] Lecture [ ] Cooperative learning groups
[ ] Laboratory [ X ] In-class exercises
[ ] Audio visual [ X ] Demonstrations
[ ] Other
7) REQUIRED TEXT(S) AND COURSE MATERIALS:
Lee Ling, Dana (2018). Introduction to Statistics Using Google Sheets™, Edition 6.0, Pohnpei: College of Micronesia-FSM. Or subsequent editions.
8) REFERENCE MATERIALS:
None.
9) INSTRUCTIONAL COSTS:
None.
10) EVALUATION:
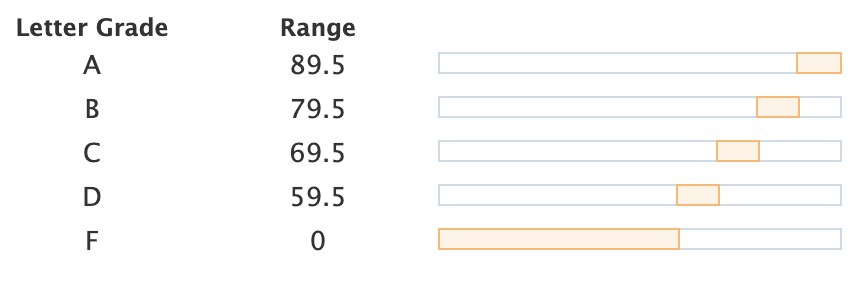
Summative evaluation is accomplished by the marking of assignments, tests, presentations, and a final examination. Presentations are scored using rubrics contained within the LMS. The course uses the following marking scale:
11) CREDIT BY EXAMINATION:
None.
| MS150 | Recommended by CC: 11/26/19 |
|
Approved by VPIA: 12/02/21 |
This website and all COM-FSM Internet based services are best viewed with Firefox 3.0 or better.
© Copyright 2026 College of Micronesia-FSM | Site Disclaimer
P. O. Box 159, Kolonia, Pohnpei, 96941 - (691) 320-2480
College of Micronesia-FSM is accredited by the Accrediting Commission for Community and Junior Colleges,
Western Association of Schools and Colleges, 428 J Street., Suite 400 Sacramento, CA 95814, (415) 506-0234,
an institutional accrediting body recognized by the Council for Higher Education Accreditation and the U.S. Department of Education.
Additional information about accreditation, including the filing of complaints against member institutions, can be found at: www.accjc.org