

Dana Lee Ling
Dana Lee Ling
College of Micronesia–FSM
Pohnpei, Federated States of Micronesia
QC
 2020
2020
Physical Science by Dana Lee Ling
is licensed under a Creative Commons Attribution 4.0 International License.
Printed in the Federated States of Micronesia
The text is structured around weekly units and a Monday, Wednesday, Thursday, Friday meeting structure with Thursday being the laboratory day. Each unit is introduced with an activity or demonstration on a Monday followed by further development on Wednesday. The laboratory on Thursday is the focus of the week - the course focuses on "doing" science, science as a process rather than a collection of memorized. Friday the information from Wednesday and Thursday are usually synthesized in a weekly wrap-up followed by a quiz or test on the events of the week.
The text sections are numbered with three digit section numbers. The first two digits are the unit number. The third digit is a one for the Wednesday interactivity, two for the laboratory, and three for the rubric. A third digit of four may be used for quizzes and tests. Digits higher than four are used for "interstitial" inter-activities or laboratories caused by holidays.
This text is not a traditional content coverage text. This text also is not a step-by-step guide to leading this course. The course is based in constructivist theories of learning, the discrepant events science of the late Tik K. Liem, and cognitive psychology. The course builds from concrete observables to provide "conceptual" hooks on which the students can "hang" new concepts. The course is also informed by Kuhn's model of Paradigm shifts. The class is seen as a community of scientists constructing a shared set of understandings about the physical world.
While the course has constructivist portions, the course does not expect students to reconstruct the last 3000 years of natural philosophy and physical science. As Newton noted, seeing farther requires standing on the shoulders of giants. Those who first generated new understandings were considered brilliant geniuses. The course also includes demonstrations, lecture, and guided learning as appropriate. The laboratories are not devoid of all content, the discovery element is tempered with guidance and some directed exploration. The laboratories do seek, however, to avoid the formulaic "fill-in-the-next-blank" cookbook structure of traditional physical science laboratories. That said, there is a blurry line between a table that guides data collection and fill in the blank unthinking recording of data.
A tension also exists between a fully complete rubric and providing space for science as discovery and exploration. The analysis section of the rubrics can "telegraph" the answer expected and shift the laboratory from exploration to an exercise in trying to get the answer the student thinks the instructor wants the student to find. In some instances, especially after midterm, the analysis section of the laboratory marking rubric is underspecified. The instructor is expected to realize this and make their own modifications to the rubric as appropriate.
There are times during the laboratories when the instructor will turn the discussion lead over to the class. At such times the instructor is looking to the students to work out a way to handle the data. For example, in the conduction of heat laboratory the instructor asks the students to design an appropriate chart or graph with which to convey their findings. The instructor is not looking for a single right solution. There is not a single right solution. The right solution is whatever the community of scientists in the room decide is the best solution. The instructor might ask questions about the solution if the instructor is confused, but the instructor is only asking for clarification and is not suggesting that the solution is necessarily inappropriate.
Throughout the text there are instructional notes. These are intentionally kept in text used by the students. Students in the course include education majors destined one day to teach in the classroom. The design intent is that the text should be a guide to these students. The text also seeks to provide a sense of transparency with regard to how the course is being taught. Text books rarely include the techniques and methods of delivery. In this course the techniques and methods are intentionally exposed, they are important parts of the course content. For those familiar with the term, the text is like Bauhaus architecture: the functional form is exposed, the underlying structure is revealed.
The fourth edition shifted from providing the theoretic speed of sound and index of refraction of water to having the students obtain this information using WolframAlpha. The fifth edition added some alternate procedures for some laboratories. The sixth edition shifted to using the Desmos free online graphical mathematics system for tables, graphs, and analysis. The sixth edition also sought to improve mobile platform display characteristics to the extent possible. Other changes included the moving of rubrics to an appendix and deletion of older material not in present use by the course.
Spring of 2020 a pandemic coronavirus led to the course being redeployed as a online course. In places, notes concerning these changes have been included in this edition. The edition was bumped a decimal point to 6.1
The following is a sample laboratory report for student reference. The basic structure is an introduction, list of equipment used, procedure that was followed, a data table, a graph, an analysis of the data, and a discussion of results that acts also as a conclusion.
[Written using a past tense prose structure, include the names of the colleagues on the research team]
Lab group: Mayleen Mori, Jeffrey Joseph, Mary Robert, and Lynnleen Albert
In the introduction tell the reader what you are going to tell them. What were you measuring? Why were you measuring what you measured? What were the scientific goals of the laboratory? What were the questions being investigated? What might be the implications, if any, of the results? Who were you working with – what were the names of your team members?
[Written using a present tense action verb - noun clause structure]
Data table can be a screen capture from Desmos. Include a caption explaining the variables and units
v1 is the volume in centimeters³
m1 is the mass in grams
Data graph can be generated by saving the Desmos graph as an image from the Share button. Label the axes.
A numerical analysis of the results based on the graph. The slope of the line and the units have some meaning in many laboratories and are often what needs to reported here. In laboratory one, for example, the slope is the density of the soap. The analysis is to report the name of the soap and the density of that soap. If there is a published value (measuring the acceleration of gravity g, the speed of sound, the index of refraction for water), include the raw error and the percentage error.
Tell the reader what you told them. Answer the questions posed in the introduction. Tell the reader whether you achieved your goals you laid out in the introduction. If a value was measured, cite the values reported in the numerical analysis (tell the reader again the value in the analysis and what that value means). Explain the physical meaning of the slope if appropriate. Explain the results of any predictions made based on the analysis. Discuss sources of possible error. Use correct grammar/syntax and vocabulary/spelling, organization, cohesion/coherence throughout the report.
General notes and comments on common physical science laboratory problems
Weather and time permitting, the first day of residential class can be an outdoor walk and talk about natural philosophy and science. The walk and talk develops the western concepts of space, time, and matter, and the concept of measuring these qualities. One approach is a historical, Aristotelian "no equipment" walk and talk. Another is one focusing on space, time, and matter without the historical components. Either approach can be taken by the instructor. Another more traditional option is to introduce the syllabus and administer a pre-assessment for later use course level assessment.
Everything else is pure energy.
Why?
Aristotle is acknowledged to be the founding father of natural science in Western culture. Aristotle introduced the idea of doing experiments in order to understand the natural world, although his experiments were more often thought experiments rather than actual physical experiments. For Aristotle, natural science was the same as natural philosophy. Science was a branch of philosophy.
Aristotle is said to have taught while walking around outside at the Lyceum, leading to the students referring to themselves as belonging to the peripatetic school. Aristotle walked and taught what he considered branches of philosophy including natural philosophy.
Peripatetic: To walk around (peri) the patio garden (patetic).
Space consists of three dimensions. Three dimensions means three directions. Think of the directions as forward-backward, right-left, up-down. Backward, left, and down are not three new directions. Backward, left, and down are simply the opposite of forward, right, and up. If forward, right, and up are positive directions, then backward, left, and down are negative directions.
Consider an ant moving on a tiled floor. The location of the ant can be given by counting the number of tiles along the wall from a corner of the room, and then the number of tiles from the wall to the ant. Two numbers would locate the ant on the floor. No more numbers would be needed. An ant that was seven tiles along the wall, and three tiles away from the wall could be said to be at (7,3). Note that this system usually presumes the walls are at right angles to each other.
If I want to describe a location above the ant on the floor, then I need a third number. I need the number of tiles above the floor. This is a third right angle. A third perpendicular direction. If the location is four tiles above the ant, then (7, 3, 4) would locate the ant. Written as variables these would be (x, y, z).
This method of describing locations in space is called Cartesian coordinates. René Descartes developed Cartesian coordinates in the early 1600s. Descartes is also credited with introducing the idea of using x, y, and z as variables and a, b, and c as constants in algebra.
Time has only one direction, forward. Time, as we experience time, cannot be stopped or reversed, not with current knowledge and technology.
Matter is the amount of stuff in an object. Matter has no direction. Only when matter moves through space can one speak about a direction. The direction is the result of movement, not a property of the matter.
Steps and beats: an introduction to thinking about space, time, and measurement.
To walk requires making steps. Steps move one through space. Steps also take time. One cannot move from one place in space to another in zero time. Movement requires changing one's location in space and time. Space and time are intertwined. Time itself is often measured as a movement through a distance on older dial-style clocks with moving hands. Today's digital watches and timers no longer show us the movement, but time is still deeply connected to space.
We can speak of the number of steps covered per beat. Per refers to division. Steps ÷ beats is a measure of space per unit time. Steps per beat can also be called a speed. In this class speed and velocity are treated as being the same.
There is a difficulty with steps and beats. Each person will measure a different number of steps for a given distance in space. Each person will also measure a different number of beats.
Motion requires the qualities space and time. The words speed and velocity both refer to motion. Other concepts may combine other qualities. Density is only possible with space and matter. Momentum will require matter, space, and time - all three qualities.
Some measures will differ in their exponent. Space squared is called area. Space squared, area, appears in the formula for pressure. Space cubed is called volume. Space cubed, volume, appears in the density formula. Time squared appears in acceleration and energy calculations. Time squared is actually an area measure of time.
Some measures differ in the scale on which the quality acts. The atomic scale vibration of atoms in solids is responsible for what is called the temperature of the solid. Temperature is related to motion, which is change in space and time. The units of temperature, however, do not appear to be units of speed.
Some measures are simply new vocabulary applied to the three qualities. Wavelength is a specific distance measured along a wave. Frequency is a rate at which something repeats measured in repeats per unit time. Angles are measures of rotation in space.
While energy can be expressed by combining units that measure space, time, and matter, energy is not space, nor time, nor matter. Energy is perhaps the hardest to describe. Among other complications is that in physical science there are different forms of energy. There are special terms to describe these different types of energy. The energy that a moving object possesses is called kinetic energy. The energy possessed by hot objects is called thermal energy. The sun produces solar energy. Gasoline and kerosene contain chemical energy.
Instructional notes on the peripatetic/Aristotelian start option: Using this option the instructor intentionally has no papers, no pens, no watch on for this course. The instructor is limited to that which a theoretical Aristotle might have had access to on a walk around the garden patio. The natural world is the science classroom. Science is not a laboratory, science is a way of thinking about the physical world.
Another option is to focus on space, time, and matter, introducing these concepts along with the three dimensions of space, one of time, and arguably none for matter. This approach would also include examples of space, time, and matter.
Instructional notes: During the summer term this has sometimes functioned as a lead off laboratory. Finding meter sticks is a weather dependent activity. The class goes out to obtain "meter sticks" only if conditions permit.
Can you count off seconds? Can you make a meter stick from a stick? Can you find a one kilogram stone?
This is a lightweight introductory lab designed to be deployed during the early days of the term when the class may still be adding and dropping students. The lab is also designed to help prepare an education major for work in a rural, village school that might not have any scientific instruments.
Curricular note: This particular mini-lab lite is more often deployed in the summer session due to the structure of the summer schedule.
In regular terms which begin on a Monday, a pre-assessment of mathematical skills is administered on Monday, reviewed on Wednesday. Wednesday is then used to introduce density using cubes of differing materials. Laboratory one occurs on Thursday. The material in 011 is essentially omitted under this structure, with metric concepts introduced on an "as needed, just-in-time" basis. During planning for the online fall of 2020, measurement was returned to the curriculum and the first laboratory was delayed until the second week of class.
Physical science has special terms used to describe measurements.
Primary measurements: A quantity that is directly measured using an measuring device or instrument. Measuring devices might include rulers, stopwatches, mass balances, protractors, and thermometers.
Calculated measurement: A quantity calculated from a mathematical combination of primary measurements.
All measurements are expressed as the combination of a number and the units of measure. Whenever I speak about a measurement in science I must say both the measurement and the units. Thus I say "Five centimeters" or "Three volts." Number and units. Together forever. Leave either one out, and the answer is incomplete and incomprehensible. Wrong.
There are two types of units of measure in science.
Fundamental units: In physical science measurements of length, mass, and time use the units of either meters-kilograms-seconds (mks) or centimeters-grams-seconds (cgs). Physical science uses only metric measurement systems.
Fundamental units measure space, time, and the amount of matter contained in an object. In laboratories either the cgs or the mks system are used.
Derived units: Measurements expressed using arithmetic combinations of fundamental units. For example, volume is derived from multiplying together three independent measurements of length. To avoid confusion these three measures are usually described as length × width × height. All three are still measures of length. Length is the fundamental measurement. Volume is the derived measurement.
Density is another derived measurement. Density is derived from the mass divided by the volume.
Yet another example of a derived unit is the metric measure of liquid volumes, the liter. A liter is defined to be 1000 cm³. The liter is defined using a fundamental unit of length.
All measurements have limits in terms of their accuracy. There are terms used to describe these limits.
Uncertainty: the limit of our measuring tools for a single measurement, our uncertainty based on the smallest measurement our tools can accurately make. For a ruler marked in millimeters there is always at least a half a millimeter of uncertainty, often more. Some electronic devices tell you the uncertainty. Global positioning satellite (GPS) receivers usually provide an estimated uncertainty.
Precision: the average variation in multiple measurements of an experiment usually expressed using the standard deviation.
Error: the difference between the measured result and the actual value. The actual value is usually unknown, hence the error is never truly known.
To "quantify" means to attach a numeric value to something. Words that are associated with quantifying space are distance, length, width, height, radius, and diameter.
Words that are associated with quantifying time are duration, interval, and frequency.
A word that is associated with quantifying matter is mass.
In this class we will use only the metric system to measure the fundamental qualities. To measure space we will use meters or centimeters. To measure time we will use seconds. To measure mass we will use grams or kilograms. .
| Quality | Quantity | Fundamental unit of measurement | |
|---|---|---|---|
| MKS | CGS | ||
| Space | Distance, length, width, height, radius, and diameter | meter | centimeter |
| Time | Duration, interval, and frequency | second | second |
| Matter | Mass | kilogram | gram |
The following is an optional exercise done in an in residence class setting. In class you will determine your height in meters and your mass in kilograms. For homework you will work on your age in seconds. Include both the number and the units.
Space: height in meters: ______________________ Matter: mass in kilograms: ______________________
A useful use of your height and mass is that these two numbers can be used to calculate your Body-Mass index. If your body mass index is over 26, then you are considered to be "overweight" for your height. This does NOT necessarily mean "too much fat." If one is a weightlifter, one can have a BMI over 26. Note that 26 is a recommended cut-off for Pacific islanders. For non-Pacific islanders the cut-off is 25.
Calculate your BMI by dividing your mass in kilograms by the square of your height in meters.
BMI = (mass in kilograms)/(height in meters)² = __________________________ kg/m²
The units of BMI, kg/m², are called derived units. Derived units are combinations of fundamental units of measurement.
Calculating your age in seconds is more complicated than simply stating your age in years. This exercise outlines how to set up a spreadsheet to calculate your age in seconds. You will also be able to determine the week day on which you were born. The intent of this exercise was to also introduce students to using functions in spreadsheets to make calculations. With the shift to using Desmos, the need for facility with spreadsheets was lost and this exercise is left in the text as a remnant.
Spreadsheets calculate your age in days. Days are not a metric unit. To convert days to seconds requires multiplying by 24 hours in one day, 60 minutes in hour, and 60 seconds in one minute.
Days × 24 hours/day × 60 minutes/hour × 60 seconds/minutes = seconds
Note that functions and formulas always START with an equals sign in a spreadsheet.
| Row | A | B |
|---|---|---|
| 1 | 1/31/2000 | =WEEKDAY(A1) |
| 2 | =NOW() | |
| 3 | =A2-A1 | |
| 4 | =A3*24*60*60 |
The value in A4 is your age in seconds at the time you entered your formulas.
I am ____________________________________ seconds old.
At one time I lived in West Africa. Among the Akan your name at birth depends only on your gender and the day of the week. These names are called day names.
| WeekDay | Day | Female | Male |
|---|---|---|---|
| 1 | Sunday | Akosia | Kwasi |
| 2 | Monday | Adjoa | Kodjo |
| 3 | Tuesday | Abenaa | Kwabenaa |
| 4 | Wednesday | Akua | Kwaku |
| 5 | Thursday | Yaa | Yow |
| 6 | Friday | Afua | Kofi |
| 7 | Saturday | Ama | Kwame |
At present you can use the conversion 365.25 days = one year. The 0.25 is why we have a leap year with a 29 February every four years. Leap years are divisible by four.
The actual conversion is 365.2422 days = one year. The actual conversion would have to be used for dates prior to 1900. In century years not divisible by 400, including 1900, there is no leap day. The year 2000 was divisible by 400, so 2000 was a leap year and included 29 February. Thus if you were born after 1900, 365.25 is the correct conversion. At least until 2100 when we skip a leap year again.
Once you know how old you are in seconds, check to see how many seconds you have left to live. Go to the DeathClock. You will need the BMI number you calculated above.
How many seconds do you have left to live? _____________________________
Is the DeathClock real? Is that how long you really have left to live? Why or why not?
Physical science can be confusing, especially as the same letters get reused with different meanings in different formulas. In laboratory one, m is the slope in the algebraic formula y = mx and m is the mass in the physical science formula density ρ = mass × Volume V. The following table is intended to help sort out what a letter might mean, can mean, in different contexts. One of the most important distinctions is the reuse of letters for variables and units. The letter g as a variable is the acceleration of gravity at the surface of the earth. The letter g as a unit is the unit of mass known as a gram. This table includes both variable meanings and unit meanings.
| Letter | Variable or constant | Unit | Equations with variable |
|---|---|---|---|
| A | amperes (current) | ||
| a | acceleration | ||
| BMI | body mass index | ||
| c | speed of light | centi- prefix: cm | E = mc² |
| d | distance | d = ѵt, d = 0.5at², d = 0.5gt² | |
| Δ% | percent difference | ||
| F | force | , F = ma, F = −kx | |
| f | frequency f | f = 1 ÷ τ | |
| h | height, Planck constant | ||
| i | current, | ||
| g | acceleration of gravity | grams | d = 0.5gt² |
| GPE | gravitational potential energy | GPE = mgh | |
| KE | kinetic energy | KE = 0.5mѵ² | |
| k | Hooke's constant, y-coor. quadratic vertex | F = kx, | |
| l | length | liters (liquid volume) | |
| λ | wavelength | ѵ = λf | |
| m | mass or slope | meters | m = ρV, |
| Ω | Ohms (Resistance) | V = iR | |
| P | Power | P = iV | |
| p | momentum | p = mѵ | |
| ρ | density | m = ρV | |
| R | Resistance | V = iR | |
| s | arc length | seconds | |
| T | temperature | ||
| t | time | ||
| τ | period | τ = 1 ÷ f | |
| ѵ | velocity | , ѵ = at, ѵ = λf | |
| V | volume, voltage | Volts | V = lwh, V = iR |
| w | width | V = lwh | |
| W | work (energy) | Watts (power) |
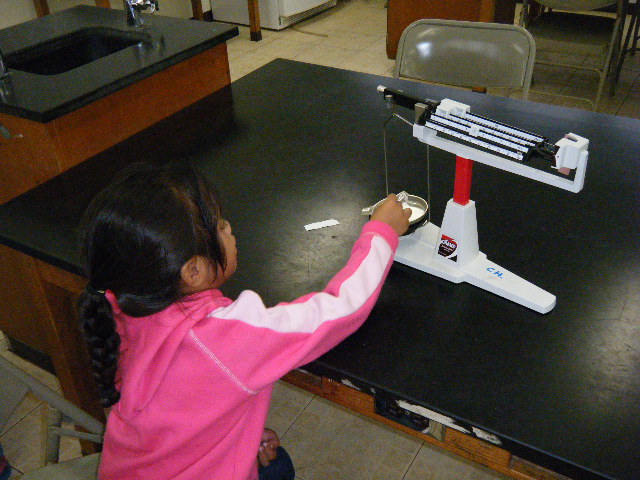
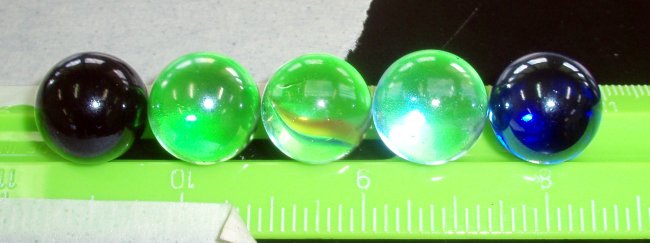
Standing on a carved soap box: density of soap
In this laboratory the mathematical relationship between the volume of a squared-off chunk of soap and the mass of the soap is explored. One result of this exploration will be a calculation of the density of the soap.
In physical science a "relationship" means how one variable changes with respect to another variable. This change is described using mathematical equations. Math is the language in which physics is "spoken."
Galileo Galilei spoke of science as "natural philosophy," a term the Greek philosopher Aristotle also used for science. Galileo noted that the universe around us is "written" in the language of mathematics:
La filosofia è scritta in questo grandissimo libro, che continuamente ci sta aperto innanzi agli occhi (io dico l' Universo'), ma non si può intendere, se prima non il sapere a intender la lingua, e conoscer i caratteri ne quali è scritto. Egli è scritto in lingua matematica,...
which might be translated as:
[Science] is written in that great book which ever lies before our eyes — I mean the universe — but we cannot understand it if we do not first learn the language and grasp the symbols, in which it is written. This book is written in the mathematical language,... – Galileo Galilei
Physicist Freeman Dyson, who studied subatomic physics in the 20th century, echoed Galileo:
For a physicist mathematics is not just a tool by means of which phenomena can be calculated, it is the main source of concepts and principles by means of which new theories can be created... ...equations are quite miraculous in a certain way. I mean, the fact that nature talks mathematics, I find it miraculous. I mean, I spent my early days calculating very, very precisely how electrons ought to behave. Well, then somebody went into the laboratory and the electron knew the answer. The electron somehow knew it had to resonate at that frequency which I calculated. So that, to me, is something at the basic level we don't understand. Why is nature mathematical? But there's no doubt it's true. And, of course, that was the basis of Einstein's faith. I mean, Einstein talked that mathematical language and found out that nature obeyed his equations, too. – Physicist Freeman Dyson
A core concept in the physical sciences is the idea that physical systems obey mathematical equations. The mathematical equations are also called mathematical models or mathematical relationships.. If two variables are related by a mathematical equation, then predictions can be made about that physical system. Physics, engineering, and chemistry all depend on predictable results. When something is done in the same way twice, the same result should occur.
One way to begin to find the mathematical equation that relates two variables is to make an xy scatter graph. The graph will help indicate whether a relation exists between the variables. The graph will also help us determine the nature of the relationship. By nature we mean whether the relationship is linear or non-linear.
If the relationship is linear or non-linear, then the system behaves in a predictable manner. Given the value of one variable, we can predict the value of the other variable. In this class we will only try to make predictions for linear relationships. Non-linear relationships are also predictable, but the mathematics is beyond the scope of this course.
If the relationship is linear, then the equation has the form y = startValue + Rate ∙ x. You may be more familiar with the form y = mx + b. In physics the slope m is often a rate of change and the y-intercept b is often a startValue. The y-intercept is not always the startValue, but for many systems the y-intercept, where x = 0, is a starting place for a system.
If we find that a relationship does form a roughly straight line, then we will try to find the slope and intercept.
The following graphs show the different types of relationship that might exist between two variables.
To decide on whether a relationship exists between two variables, start with an xy scattergraph. Looking at the graph, consider the following questions:
If the data points form roughly a straight line, then use the spreadsheet function SLOPE and INTERCEPT to obtain the slope and intercept. The slope and intercept can also be displayed on the graph directly. If the data points form a smooth curve, then the relationship is a non-linear relationship. Determining the nature of the relationship may or may not be possible for us in this course. If the data points form no pattern, then there is no relationship between the variables being studied.
The following decision flow chart is a map of the flow of decisions described above.
Desmos graphing calculator is used to find mathematical models for data. If an instructor chooses to use spreadsheets, then the following two spreadsheet functions calculate the slope and intercept for any linear relationship. Note that the y-data is first in the formula, followed by the x-data. These functions are only necessary
=SLOPE(y-data,x-data)
=INTERCEPT(y-data,x-data)
If the data points form a line, then we can draw a line through the points. This line that best goes through the data points is called a best fit line, trend line, or a linear regression.
Note that because of uncertainty in primary measurements and error, data is considered linear even when the data falls only roughly along a straight line. The data does not have to fall exactly in a straight line. The issue of how close data comes to a straight line is part of the study of correlation in statistics.
One of the first persons to base hypotheses on experiments was William Gilbert (1544 - 1603). Gilbert noted the need for experiments to be repeated to ensure that the result is consistent. He also cautioned those that repeated his experiments to "handle the bodies carefully, skillfully, and deftly, not heedlessly and bunglingly." The Scientists, John Gribbin, page 71. Library, Amazon.
So too should you measure carefully, with skill, patience, and attention to accuracy. Measurements should be repeated to ensure an accurate result.
In this laboratory you will explore the relationship between volume and mass for soap. You will measure the length, width, and height of a soap slab, calculate the volume of soap slab, and measure the mass of the soap slab. A graph of volume versus mass will be made. If a relationship is found, then the mathematical equation of the relationship will be calculated. Remember, "a relationship" simply means that a pattern such as a line or curve is formed on an xy scattergraph of the two quantities. That relationship is usually expressed as a trend line. The slope of the trend line will have a physical meaning.
Run a demonstration density calculation using the wood alphabet block and a lead cube. Ask the class to predict the result prior to putting the object in water.
The equation:
is of the form
where volume is x, mass is y, and the density is the slope m.
The theory behind this laboratory is that the slope of the linear regression line for the volume versus the mass is the density. According to theory, density should be the same for a substance no matter whether the piece is large or small. If this is true, then a plot of volume versus mass should produce a straight line with a slope equal to the density.
In this laboratory the units of mass are grams, the units of volume are cubic centimeters, and the units of density are grams per cubic centimeter.
Length, width, height, and mass are fundamental quantities. Both volume and density are "derived" quantities.


The following procedure was developed for use at home by students.
Brand of soap used:
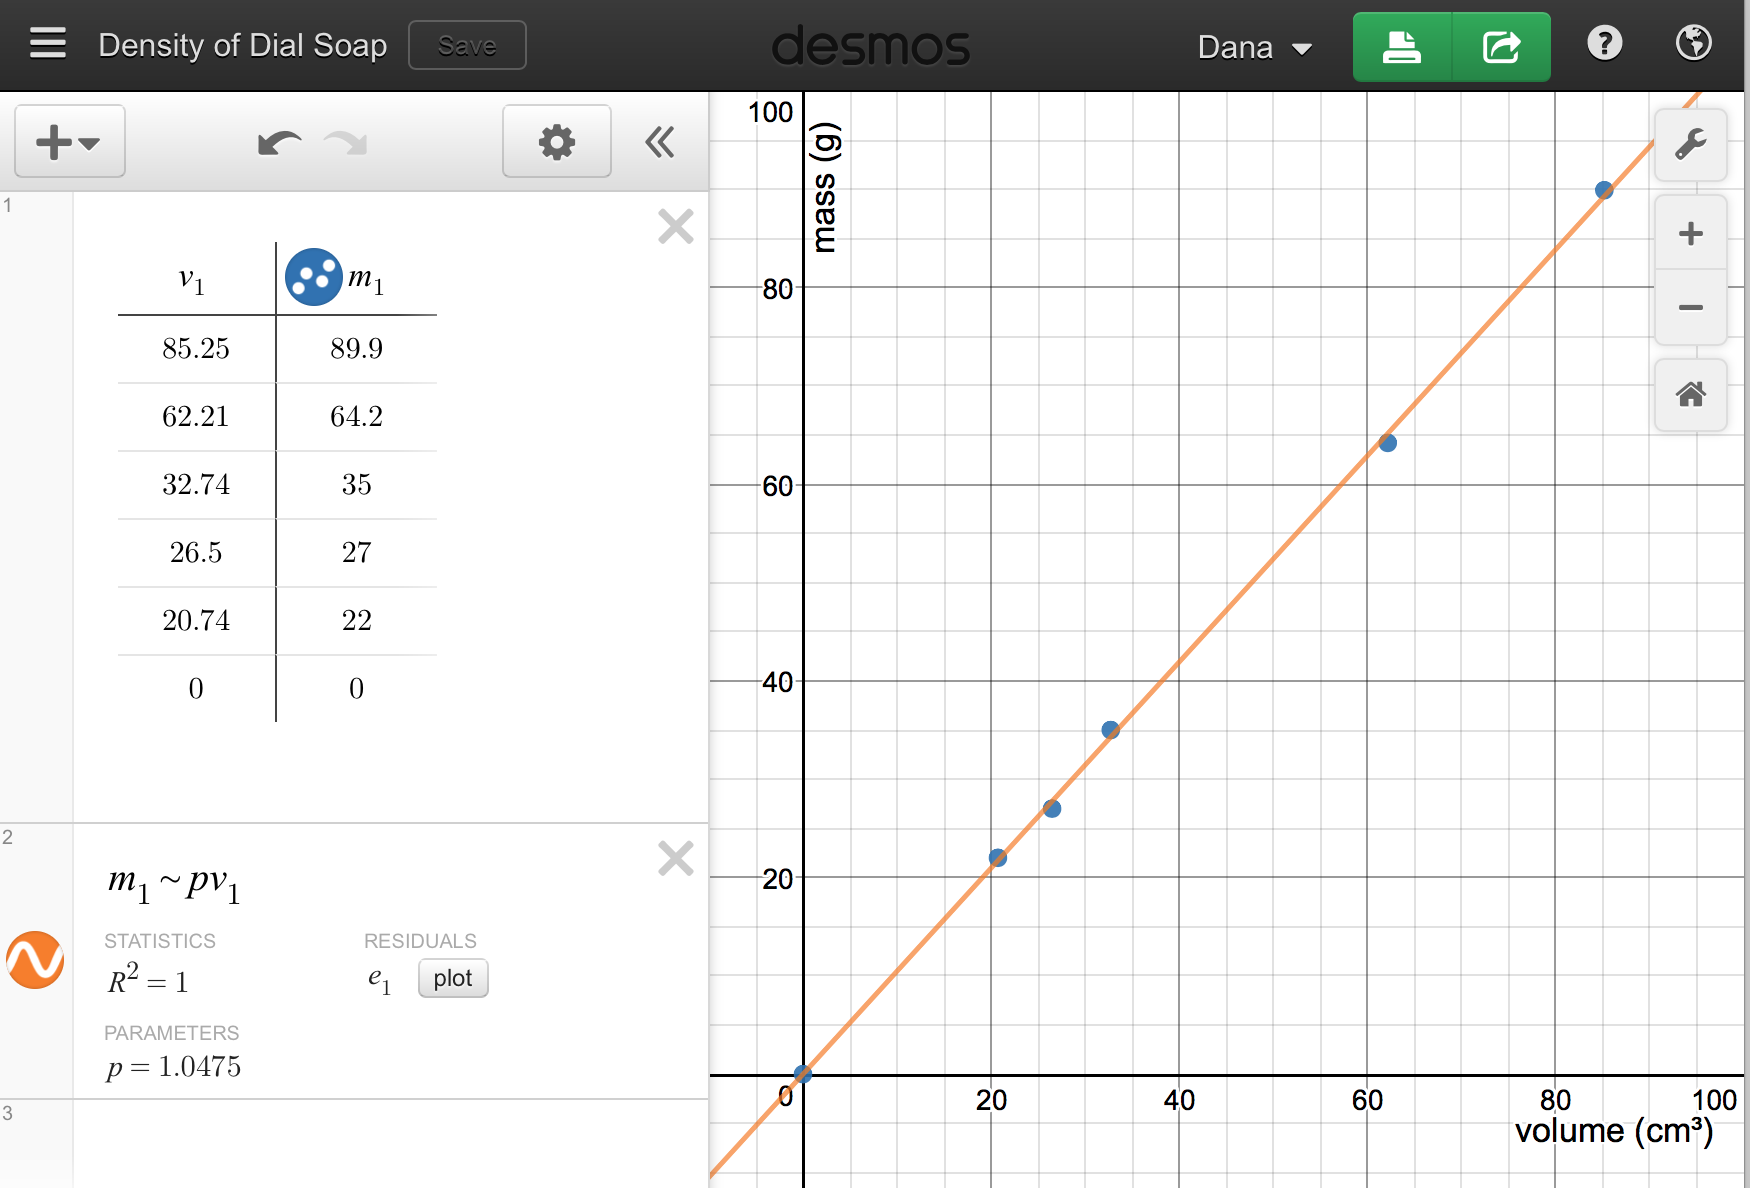
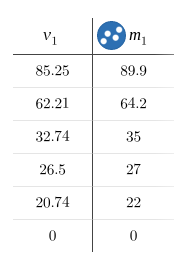
| Length (cm) | Width (cm) | Height (cm) | v1 | m1 |
|---|---|---|---|---|
v1 is the volume in cm³
m1 is the mass in grams
Note: Do not put units into the table. In Desmos enter only the v1 and m1 columns.
If using Desmos, entering v1 versus m1 will generate a graph. Add labels to the axes of the graph and adjust the domain and range minimum and maximum from the graph settings (monkey wrench icon). If using alternate software for graphing, follow the directions of the instructor.
The analysis is to determine the density of the soap from the slope of the line. mass = density × volume or m = pV where Desmos uses m1 for m and v1 for V. Use the Desmos regression model m1~pv1 where p is the slope of the line and thus the density of the soap. Report the results of your analysis above. Include the slope and the units for the slope, grams per centimeter cubed. Explain the physical meaning of the slope as the density of the soap. Note that the units for the y-intercept are not the same as the units for the slope. When reporting the y-intercept, the units are the same as those on the y-axis, grams.
Report the mathematical relationship of volume and mass, including both the slope and intercept. Discuss the physical meaning of the slope.
Mathematical relationships allow predictions to be made.
The density of water is close to 1.0 g/cm³
If the density of an object is greater than one, then the object will sink.
If the density is less than one, then the object will float.
In the discussion note whether the soap would be predicted to float or sink based on the density (which in turn is based on the slope of the line through the data).
In the discussion include whether the soap floated or sank when put in water.
Did the predicted behavior happen?
Instructional note: If a separate computer laboratory is being used, bring some of the remaining chunks of soap to the computer laboratory along with a large beaker of water. Have the students use their density results to predict whether their soap floats or sinks. Reinforce the link between slope and density. Then test the prediction. Did the soap know the answer?
Use Desmos and a word processor to write up the laboratory report.
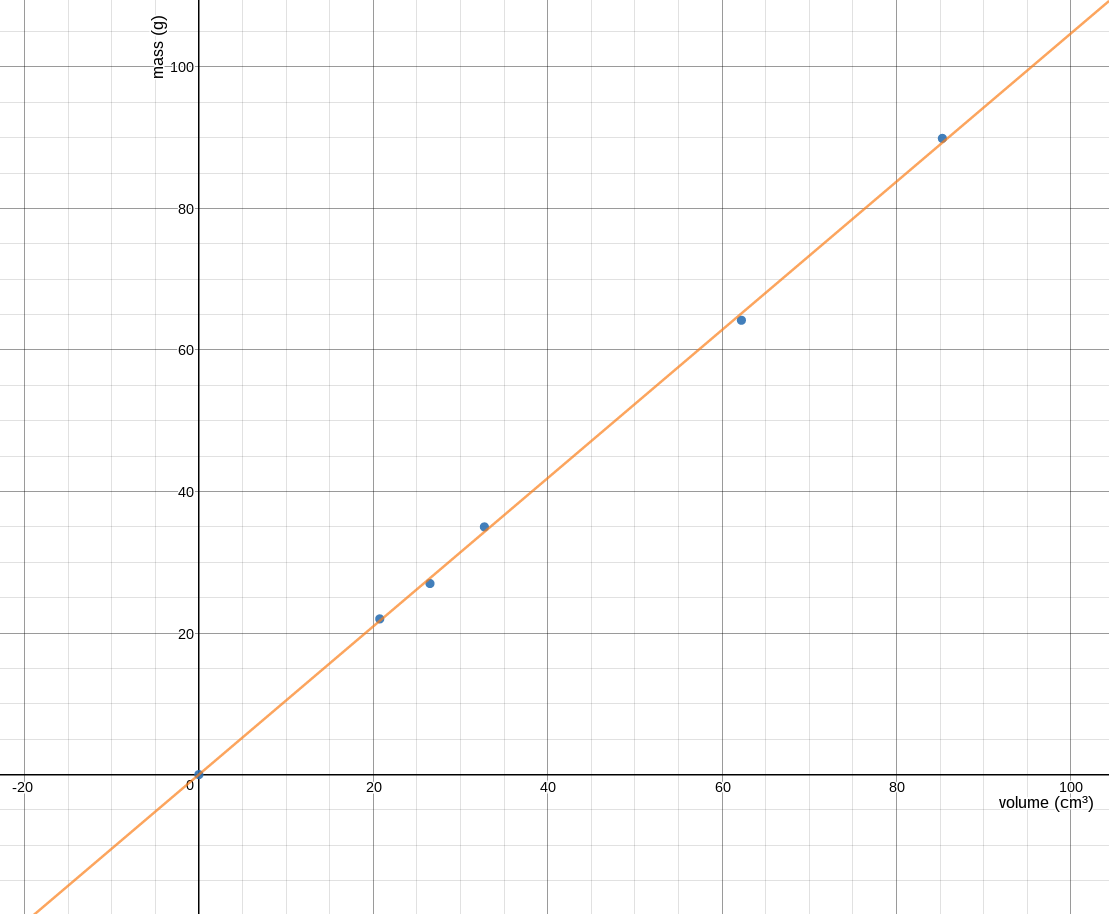
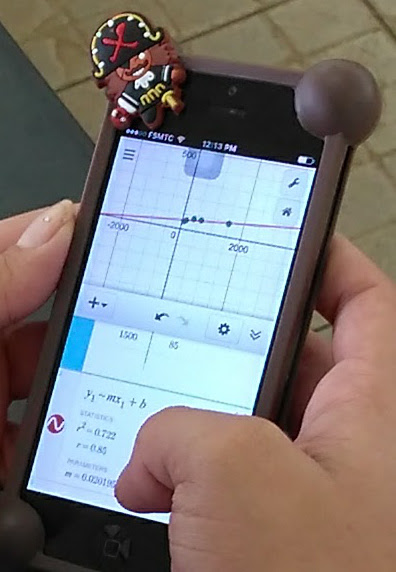
Desmos can be accessed from a browser on a computer or via an app on a smart phone. Add a table. Change the first variable to v1 for volume. Change the second variable to m1 for mass.
Note that the image in this section is from Desmos running on a smart phone, generated by entering data directly into Desmos during the laboratory. This provides immediate graphical feedback during the laboratory procedure.

V1 is the volume in centimeters³
m1 is the mass in grams
To obtain the slope, enter the equation:
m1~pV1
Note that p is the slope which is also the density of the soap.
Note too that Desmos is case-sensitive. If a lowercase "m" is used for the mass and an uppercase "V" is used for the Volume, then the regression formula must also use the same cases. Data for the above image was produced using the alternate procedure where the mass is known only from the package labelling and only two cuts are made in the soap. This variation was designed to be deployed in an online environment.
If working in a browser with Desmos, save an image of the graph. Screen capture of a region of the screen can be used to capture the table and analysis. Remember to put a caption under the table labeling the variables and units. For Microsoft Windows, screen capture of a region on the screen can be accomplished with the Snipping Tool. For Apple MacOS use command-shift-4 and select the region to capture. On ChromeOS use control-shift-switch window and select the region to capture. On Ubuntu use shift-print screen and select the region to capture. For guidance, refer also back to the sample laboratory.
Note that density was matter divided by space. In that formula space was cubed. Full three-dimensional space. In the world of physical science the degree is the number of dimensions.
Motion is space divided by time. For motion, space is not squared nor cubed. Space is to the first degree. Linear. One dimensional. Motion has a single direction.
Measuring motion requires measuring both space and time. Space is measured using meters or centimeters. Time is measured using seconds. Motion in a direction is called velocity in physical science. Motion without reference to a direction is called speed. Working with motion in a direction usually requires working with vectors and trigonometry. In this section we will restrict ourselves to straight line motion. In straight line motion velocity and speed are the same thing.
If the distance is measured between two points in space, and the time is measured between two points in time, then the above formula is sometimes expressed as "the change in distance" divided by the "the change in time." The Greek letter delta (Δ) is used for the words "the change in."
The above formula is mathematically the same structure as the formula for the slope of a line between two points.
In physical science the relationship between distance, velocity, and time is often algebraically rearranged and written:
A rolling marble passes 0 centimeters (cm) at a time of 1.5 seconds (s). The marble passes 100 centimeters at a time of 3.5 seconds. Calculate the velocity of the marble.
Alternate Monday introduction: A caster board can be ridden past columns with elapsed time recorded in seconds as the board passed the columns. The distance from the start of the run to each post was also measured. As homework the students were to graph the time versus the distance and determine the slope of the line.
A video introduction was produced for remote use fall 2020.
A graph of duration versus distance is a graph of time versus space. The linear relationship distance = velocity × duration is a relationship between time and space.
On a graph of duration versus distance one gets a straight line if the speed is constant. The actual path over the ground might be straight or curved.
In graph one on the left above, time is plotted against space in the form of duration in seconds against distance in centimeters. The object, for example a rolling ball, is moving at a constant speed. The graph on the right is a "bird's eye view" of a ball rolling in a parking lot. The ball may roll straight, left, or right. The speed of the ball along the path is not displayed by graph two. The curve seen is the curvature of the ball along the ground.
Note that in vector physics velocity is always a speed in a particular direction. Change the speed, and the velocity changes. Change the direction, and the velocity also is said to change. A ball moving at a constant speed on a curved path is changing directions. The speed is staying the same but the velocity is changing. This is the difference between speed and velocity. Speed has no specified direction, velocity has to take into account the direction.
Graphs of time versus space, duration versus distance, do not tell us the direction of motion. Time versus distance depicts only the speed as the slope of the line. If the slope is changing, then the speed is also changing.
Graph three shows a ball rolling with the speed of the ball changing.
Note that the above graph says nothing about the direction that the ball is rolling. The information is only about how far a distance the ball has moved from zero centimeters in how long a duration of time in seconds.
This optional activity is also an opportunity to introduce GPS receivers, their operation, the screens displayed, and differences among the GPS models in use in the class. This introduction is important to activity 071 later. The GPS can be used to obtain walking speed, running speed. A sports ball radar gun can obtain thrown ball speeds, speed of cars along the road.
Using instruments that measure time and distance, determine your speed. Weather cooperating, as a class we will go outside and use global positioning satellite receivers to determine how slow we saunter, stroll, walk, stride, jog, or run.
Rolling balls gather no moss
Is there a linear relationship between the time and distance for a ball rolling on level ground? How does this relationship change with changes in speed?
This laboratory explores the relationship between time and distance for an object moving at a constant velocity. As noted in the first laboratory, in physical science a "relationship" means how one variable changes with respect to another variable. This change is described using mathematical equations. Math is the language in which physics is "spoken."
For a rolling ball, distance increases as time the ball rolls increases. For a ball rolling at a constant velocity (speed), this relationship is predicted to be linear. This laboratory explores the relationship between the velocity (speed) of the ball and the slope of the resulting line.
Roll a ball along a length of sidewalk that has distance measurements marked off. Time the passing of the marks with a chronograph that can record split times. Record the time in seconds versus the distance in meters. Make at least three sets of measurements (three tables) for a slow ball, faster ball, and fastest rolling ball.
Desmos permits multiple separate tables of data to appear on a single graph. Students can record three separate time and distance tables. These can be entered into Desmos. For the first table use the variables t1 and d1 for time and distance. For the second table use t2 and d2. For the third table use t3 and d3.
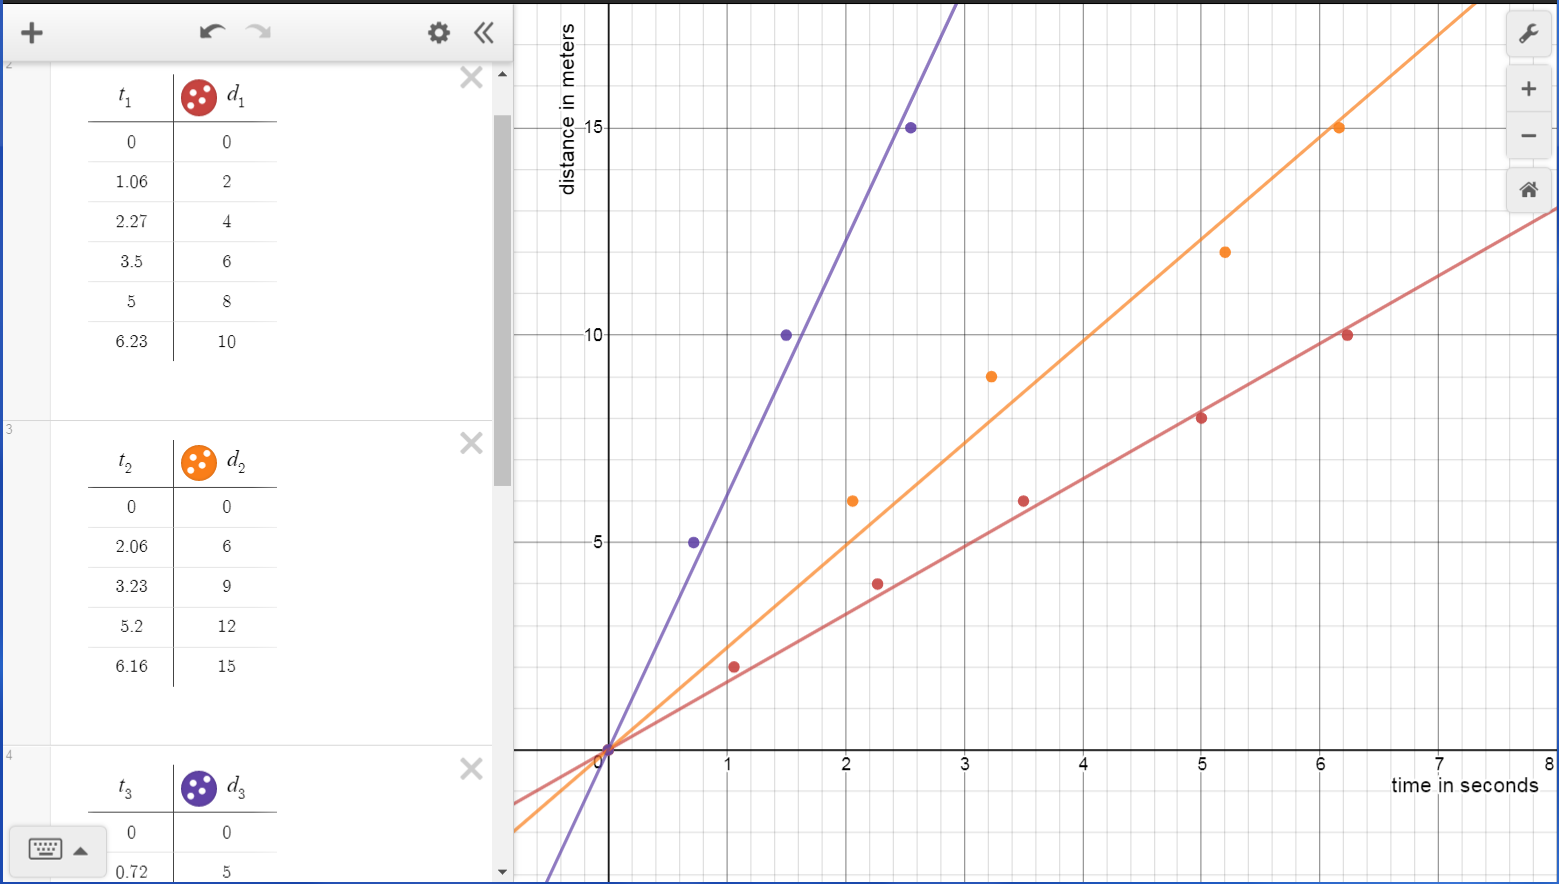
To obtain the slope of the lines, which is the speed of the ball, use the three regressions:
d₁~v₁t₁
d₂~v₂t₂
d₃~v₃t₃
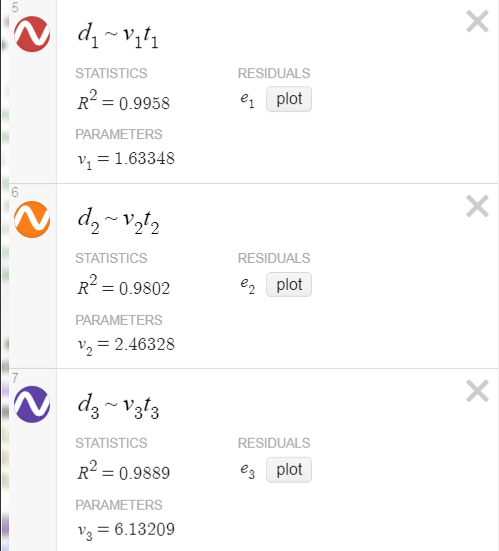
A graph is one of the first tools one uses when exploring new data. A graph will visually indicate whether a two variables are related and and what that relationship might be. Using the data, make a single graph with the multiple ball runs on a single graph.
The velocity of the ball is the slope of the line for that ball.
In algebra the equation of a line with a zero y-intercept is written as y = mx where m is the slope. In physical science the slope is usually a rate of change. In this laboratory the slope is the speed of the ball. We use the letter v for velocity (speed in a direction) in formulas.
distance d = slope (speed v) × time t
d = v × t
This sometimes written simply as d = vt
Given any time t, we can calculate the distance d. Given any distance d, can solve for the time t.
Discuss the nature of the mathematical relationship between distance and time for a rolling ball. Discuss how different starting speeds affect the slope of the relationship. How is slope related to speed? Discuss whether the relationship appears to form the straight line predicted by the d = vt theory.
Monday pre-activity: acceleration from rest for a moving object. Acceleration as a change in velocity with respect to time.
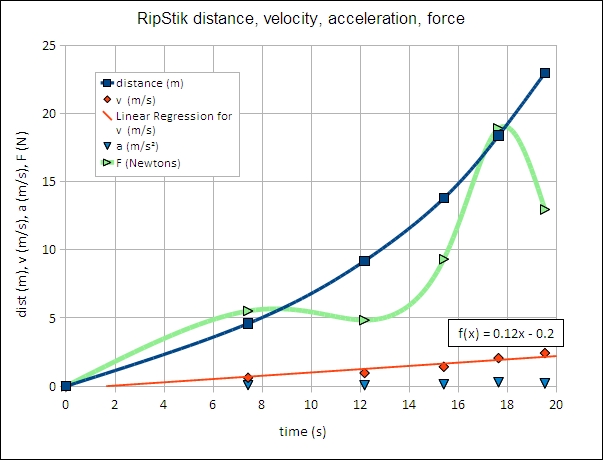
Acceleration is the change in velocity divided by the change in time. As an example, a RipStik was accelerated from rest to 1.34 m/s in 3.43 seconds, and then accelerated to 1.78 m/s in the next 2.59 seconds. The chart shows the time versus distance, velocity, and acceleration curves for the RipStik spring term 2010.

| location | time (s) | distance (m) | velocity (m/s) | mass (kg) | momentum (kg m/s) | force (kg m/s²) |
|---|---|---|---|---|---|---|
| pillar one | 0 | 0 | 0 | 67 | 0 | 25.3 |
| space | ||||||
| pillar two | 3.49 | 4.6 | 1.32 | 88.31 | ||
| space | 5.21 | |||||
| 6.46 | 9.2 | 1.55 | 103.77 | |||
| pillar three |
In this activity we will explore the shape of the path through the air made by a sphere. The path is a path in two-dimensional space. The graph will be a space versus space graph using the MKS system. The path reflects the influence of the acceleration of gravity on the sphere. The acceleration of gravity accelerates masses toward the center of the Earth at 980 centimeters per second squared. The result is a parabolic path.
We will be working outside to measure the arc of the sphere. The set-up and variables to be measured are seen in the following diagram.

Where k is the height of the y-intercept above the x-axis
and r is the distance from the axis of symmetry to one x-intercept (root).
| Task | n | Position title | Student name | x | y |
|---|---|---|---|---|---|
| Right x-intercept | 1 | Ball underhand pitcher | |||
| 2 | Meter stick holder | ||||
| 3 | Recorder | ||||
| right mid arc height | 4 | Tape measure holder | x | y | |
| 5 | Tape base holder | ||||
| 6 | arc height observer | ||||
| 7 | Data recorder | ||||
| Vertex height k | 8 | Tape measure holder | Same as 4 | x | y |
| 9 | Tape base holder | Same as 5 | |||
| 10 | Vertex position observer | ||||
| 11 | Data recorder | ||||
| left mid arc height | 12 | Tape measure holder | x | y | |
| 13 | Tape base holder | ||||
| 14 | arc height observer | ||||
| 15 | Data recorder | ||||
| Left x-intercept | 16 | Ball catcher | x | y | |
| 17 | Meter stick holder | ||||
| 18 | Recorder | ||||
| x-intercept to x-intercept | 19 | Wheel roller | distance = 2r | ||
| 20 | Recorder | ||||
Another way to introduce the unit on acceleration is to accelerate a swizzle board such as a RipStik along a flat stretch of sidewalk marked off with chalk. A time verus distance graph will show that the velocity is increasing. As homework on Monday the time versus distance table and graph can be assigned. If using Desmos, have the students use t₁ and d₁ as in laboratory two. Ask them to run a regression equation d₁~vt₁ and see how well that fits. Ask them to then try d₁~½at₁² in Desmos. Which mathematical model fits the data better?
What is the nature of the relationship between the time and distance for a ball falling to the ground?
If the velocity is changing at a constant rate, then there is a constant acceleration which would be called the acceleration of gravity.
What is the value of the acceleration of gravity g?
This laboratory explores the relationship between time and distance for an object moving at a constant acceleration. In this situation the velocity is changing.
Instructional note. This laboratory builds on two earlier activities that during a regular school usually occur on Monday and Wednesday respectively. The first activity was a plot of time versus distance for a RipStik accelerating from rest. Based on the RipStik activity, there was a non-linear relationship (curved line) between time and distance for the accelerating RipStik. In the second activity, the RipStik is swizzled into an upslope crossing a distance equal zero line at the bottom of the slope. The RipStik decelerates until at a minimal speed the RipStik is turned around and then accelerated back across the starting line. This yields an inverted parabola which can be modeled in Desmos using d₁=½at₁²+v₀t₁ The following lab reproduces the arc of Monday but for a falling ball.
Existing gravitational theory asserts that the distance an object falls when dropped is given by the mathematical equation:
or
The theory predicts that graph of time versus distance should result in the half-curve of the start of a quadratic parabola as seen in graph 3.1.
The graph suggests that time and distance are not related linearly. That is, twice as much fall time results NOT in twice as much distance fallen, but in MORE THAN twice as much distance fallen.
Proving the hypothesis that a time versus distance graph is actually a parabola is difficult and generally requires calculus. Rather than prove that the curve must be parabolic, the laboratory will seek to show that the curve is well fitted by a parabolic model.
Laboratory teams will drop a ball timing the fall time for the ball.
Teams of three to four students will be formed composed of the following roles to facilitate measurements:
Notes
Scratch table for jotting times in the laboratory.
| 1 m | 2 m | 3 m | 4 m | 5 m |
|---|---|---|---|---|
The median times versus the drop height will be recorded into the table below and then plotted on an xy scattergraph, with the time in seconds on the horizontal x axis and the drop height in meters on the vertical y axis.
| t₁ | d₁ |
|---|---|
| 0 | 0 |
| 1 | |
| 2 | |
| 3 | |
| 4 | |
| 5 |
t₁ is the time in seconds
d₁ is the distance in meters
* After completing the data up to two meters inside the classroom, groups will work with the instructor to attempt to gather data at four and five meters using a balcony.
If working in Desmos, the graph will appear as data is entered into the table. If using other graphing software, follow the instructions of the instructor.
Use the Desmos regression d₁~0.5gt₁^2 to obtain the experimental acceleration of gravity g. Note that using the cursor and the Desmos keyboard, the formula can be entered as d₁~½gt₁².
On the graph the rise is meters and the run is seconds². Slope is rise over run. Therefore the units of slope and of the acceleration of gravity are m/s².
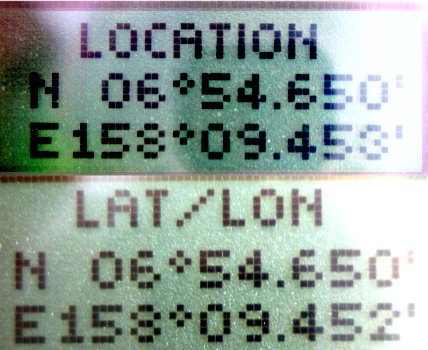
The published value for the acceleration of gravity is close to 9.8 m/s². Subtract 9.8 m/s from the experimental acceleration of gravity g to obtain the raw error. In physical science 9.8 m/s² is used. The actual value of acceleration of gravity at the location of Pohnpei, 7° North 158° East, is 9.78543 m/s².
The percentage error is the raw error calculated above divided by the published value of the acceleration of gravity g, expressed as a percentage.
Report the experimental and published acceleration of gravity along with the raw error and percentage error in the analysis section of the laboratory report.
Discuss the nature of the mathematical relationship between time and distance for a falling object. Discuss whether the graph is reasonably close to a parabola. Report the experimental acceleration of gravity g based on the slope from the graph. Compare your result to the theoretically correct value of 9.8 m/s² Discuss any problems you encountered in this laboratory including those that may have contributed to uncertainty in your measurements.
Note that an percentage error of less than 5% is excellent agreement in this laboratory. An error less than 10% is good agreement. And an error less than 20% is still moderate agreement with the published value for this particular laboratory.
While momentum is mathematically defined in physical science as the mass of an object multiplied by the velocity of the object, momentum can be thought of as being the tendency of an object in motion to remain in motion. An object at rest will tend to remain at rest.
Energy in this section refers to two different types of energy: gravitational potential energy and kinetic energy. Gravitational potential energy is the energy of position. Kinetic energy is the energy of motion.
Sir Isaac Newton wrote in a letter to the Jesuit scientist Ignace Gaston Pardies:
For the best and safest method of philosophising seems to be, first to enquire diligently into properties of things, and to establish those properties by experiments and then to proceed more slowly to hypotheses for the explanation of them. For hypotheses should be employed only in explaining the properties of things, but not assumed in determining them; unless so far as they may furnish experiments.
Letter to the French Jesuit, Gaston Pardies. Translation from the original Latin, as in Richard S. Westfall, Never at Rest: a Biography of Isaac Newton (1983), page 242. Direct source: The Renaissance Mathematicus.
Newton started with diligent inquiry using experiments to establish properties and then used those properties to build hypotheses. The Greek philosophers, in contrast, often started with a hypothesis and rarely did experiments. In this exploration you are starting with inquiry and attempting to move towards a hypothesis.
This exploration was of conservation of momentum in a collision of marbles. Conservation means "stays the same." In a momentum conserving collision we mean that the momentum after an event is the same as the momentum before an event. For this exploration the "event" was a collision between sets of marbles.
Momentum is the mass multiplied by the velocity. The lowercase Greek letter rho ρ is used for momentum, m is used for mass, and v is used for velocity (speed). The lower case Greek letter ρ looks like the English letter "p" but is the lowercase letter "r" in Greek. We can see this "p" shape in the English capital letter R. I have never seen an explanation of why density uses the letter ρ, but "d" was already in use for distance.
The momentum ρ is defined as the mass multiplied by the velocity (speed). Momentum takes into account both the mass and the velocity. If "mass in" equals "mass out" and "speed in" equals "speed out," then the product of mass times speed in should also be equal to mass times speed out. That is, "momentum in" should be equal to "momentum out." This is called conservation of momentum.
Both momentum and velocity have directions associated with them, both are vector quantities. This means they are usually written with an arrow on top of the symbol for them. Marbles have a mass, their velocity is a speed in a particular direction. The tracks keep the marbles moving in the same single direction. In the world of science this is a one-dimensional model and keeps the mathematics simpler.
Written without the vector notation and subscripts, the momentum is ρ = mv where m is the mass and v is the velocity.
Laboratory four explores the relationship between the gravitational potential potential energy and kinetic energy. Gravitational potential energy is energy due to an elevated position. Kinetic energy is the energy an object has due to motion. When a marble rolls down a slope the gravitational potential energy is converted to kinetic energy. The same happens when a car rolls down a hill.
Questions
Materials
Procedure
Table
If using Desmos, graph the height h1 against the velocity v1.
| h1 | v1 |
|---|---|
Caption: h1 is the height in centimeters. v1 is the velocity in centimeters per second.
Note that the table in Desmos will have six to ten rows, the above is just an illustration of the layout.
Graph
Make a graph of the data. Does the data form a straight line? Does the data form a smooth curve? Does the shape look familiar? The shape of a curve sometimes tells us the nature of the mathematical rule that the system is obeying.
Instructional note for instructors: Note that the graph is not a time versus space graph. The slope of a time versus distance graph was the velocity. This graph will be a height (space) versus velocity (space divided by time) graph. The slope is NOT the velocity.
In experimental physics we sometimes seek help from theoretical physicists who work with the mathematics and guide us in finding equations. If the data agrees with the equation, then that provides support for the mathematical result that the theoretical physicists have calculated. The following is an exploration of the theory, a theory that will lead to an equation.
Gravitational potential energy is energy contained in an object due to its position or composition. Objects at rest a height h above a surface have gravitational potential energy due to their position. Gravitational potential energy is equal to the mass multiplied by the acceleration of gravity g multiplied by the height.
Gravitational potential energy = mass × gravity × height
Note that the acceleration of gravity g is 980 cm/s². Although on Pohnpei the acceleration of gravity is 979 cm/s², that value is often rounded off to 980 cm/s², a value closer to the global average of 980.7 cm/s².
The "potential" part of the phrase refers to the "potential" for the energy to be converted to other forms of energy. In this activity the gravitational potential energy will be converted to kinetic energy. Gravitational potential energy is not the only type of potential energy, there are other forms of potential energy. Springs and rubber bands can store potential energy, as can bonds between atoms.
Letters in physical science can be very confusing. The g above is being used as a variable. In physical science g as a variable means the acceleration of gravity. The letter "g" is also used as unit. The letter g as a unit means "grams." Grams is a measure of the mass m. A regular marble has a mass of about five grams, often written as 5 g. Letters in physical science are often used with different meanings as variable and units. Only the context can tell you the meaning of a letter.
Kinetic energy is the energy of motion, the energy that an object with a mass m has as a result of moving at a velocity v. Kinetic energy is actually the integration of the momentum with respect to velocity, but that is mathematics that is beyond the scope of this course. The kinetic energy KE can be calculated from the equation ½mv²
The Conservation of energy states that energy can neither be created nor destroyed. Energy can only be converted between different types of energy. The conservation of energy suggests that the gravitational potential energy of the marble on the slope should be equal to the kinetic energy of the marble at the bottom of the slope.
There is one complication in the following calculation: at the bottom of the slope the marble has TWO kinds of kinetic energy. Have you ever spun a coin on one edge? The coin keeps spinning. The spinning coin has rotational kinetic energy. There is also rotational momentum. Thus the following includes consideration of both the linear kinetic energy of the marble in motion and the rotational energy of the marble because the marble is also spinning as the marble rolls.
Instructional note for instructors: What follows is the theory. The key point here is not that students will derive these equations, but to show how the mathematical equation is derived. The students are not trying to construct the theory.
The conservation of energy can be expressed mathematically as:
gravitational potential energy at start = kinetic energy at end
Remember that there are TWO forms of kinetic energy to account for in this experiment: linear kinetic energy and rotational kinetic energy. Therefore:
GPE = KE + RE.
Gravitational potential energy = mass m × acceleration of gravity g × height h.
Linear kinetic energy (KE) is the energy that an object moving across a surface. Linear kinetic energy is equal to:
where m is mass and v is the velocity.
Rotational kinetic energy (RE) is the energy of a rotating object. Rotating means spinning. As the marble rolls the marble spins. Rotational kinetic energy is equal to:
...where I is the rotational inertia of the spinning object.
In this activity the linear velocity (speed) of the marble, v, will be measured. The rotational inertia is related to mass and velocity by the following relationships for a marble with a mass m and a radius r.
The following is a sketch of simplifying GPE = KE + RE.
In the above expression 1400 is in the units of acceleration: cm/s². After substitution and simplification the relationship between the velocity and the height is given by the following equation.
Note that the mass and radius (size) of the marble is irrelevant to the speed. Note too that the speed is proportional to the square root of the height. This is not a direct relationship, not a linear relationship.
The above suggests that we can sse the Desmos regression v1~k√h1 as a mathematical model where k is constant that Desmos will optimize. The theory predicts k should be 37.4. Note that the square root symbol √ can be entered using the Desmos keyboard or by typing SQRT when entering the regression in Desmos: v1~kSQRTh1
Discussion and conclusions
Does equation suggested by the theoretical physicists have a shape that agrees with your data? Why or why not? What factors might be affecting the system? A good experimenter thinks about and identifies the factors that might have introduced errors into their measurements.
The key idea is that mathematical models form shapes on graphs.
The shape of the line tells you the form of the equation.
And hypotheses in physical science are often these same equations.
When a hypothesis is confirmed beyond reasonable doubt, it is called a law.
A line means the system is represented by a linear mathematical equation.
A parabola means the system is represented by a quadratic equation.
A parabola on its "side" (seen above) is a square root equation.
The experimental data forms a shape that suggests a square root relationship.
This then provides support to the theory.
Note that two lines are not equivalent, just of the same shape.
The actual data may produce a lower speed than predicted by theory due to friction.
In the centimeter-gram-second system energy is in units called ergs. One erg is a very small amount of energy. An erg is an ant push-up.
This variant was developed in 2014. Large percentage errors in timing and friction with the banana leaf plagued the design. Students became bogged down in dealing with a difficult system to work with and lost sight of the larger concepts that the laboratory was meant to convey. This variant has not seen use since 2014.
Introduction
This laboratory explores the concepts of momentum and conservation of momentum.
Questions
Existing theory asserts that momentum is conserved. At first you will qualitatively explore the conservation of momentum. Then you will make some quantitative measurements of momentum for marbles inbound and outbound from a collision.
In physics:
Equipment
Qualitative explorations
Five marbles sit touching each other in the middle of a banana leaf marble track. One or more marbles are rolled from one end of the track and allowed to collide with the five stationary marbles. The students observe how many marbles are kicked out from the line of five marbles.
Quantitative explorations of a single marble inbound
Said "mathematically," the momentum before is equal to the sum of the momentums after is written:
Pbefore = Pafter
minbound × vbefore
=
moutbound × vafter
where m is the mass of the marble, v is the speed of the marble.
Data tables
| mass inbound marble | × | velocity inbound | = | momentum in [x] | mass outbound marble | × | velocity out | = | momentum out [y] | ||||
|---|---|---|---|---|---|---|---|---|---|---|---|---|---|
| mass m (g) | × | distance (cm) | ÷ | time (s) | = | momentum (g cm/s) | mass (g) | × | distance (cm) | ÷ | time (s) | = | momentum (g cm/s) |
| × | ÷ | = | × | ÷ | = | ||||||||
| × | ÷ | = | × | ÷ | = | ||||||||
| × | ÷ | = | × | ÷ | = | ||||||||
| × | ÷ | = | × | ÷ | = | ||||||||
| × | ÷ | = | × | ÷ | = | ||||||||
Transfer the momentum results to the following table. The following is the data to be graphed.
| momentum in p (g cm/s) [x] | momentum out p (g cm/s) [y] |
|---|---|
| 0 | 0 |
Graph
Make an xy scattergraph with the momentum in on the x-axis, momentum out on the y-axis
Analysis and brief discussion [a]
Instructional note: In practice the timing is prone to large errors. Friction complicates efforts to accurately record the outbound marble speed. The students become "bogged down" in the complexity of getting accurate times and lose sight of the larger picture of the physics happening. The more qualitative approach followed by presentations appears to yield a better insight in the concept of the conservation of momentum. In this alternate version the instructor is left in the position of arguing that momentum would be conserved but for friction and spin up/spin down loss of rotational energy/momentum.
Notes from the field for instructors: In this laboratory we explore conservation of linear momentum. Another momentum that is conserved is angular momentum. Angular momentum is the momentum of spinning. Spinning objects tend to continue to spin. Objects that are not spinning tend to remain at rest – to not spin. Think of a child's toy top. In the experiments above we considered only linear momentum, but the marbles are spinning as they move on the track. In these experiments spinning marbles hit non-spinning marbles. The inbound marbles lose speed and thus spin, the outbound marbles go from not spinning (sitting still on the track) to spinning very quickly. These changes in spin momentum are likely to be related to why linear momentum is consistently "lost" in these collisions.
Where linear momentum is p = mv, the angular momentum L = Iω where I = 0.4mr² and ω = v/r. Thus the angular momentum of a marble is L = 0.4mrv. One cannot just add all the momentums and hope for the best: the units are different. Ultimately one has to retreat to an energy position noting that the potential energy must appear as both linear and rotational kinetic energy in the marbles post-collision, along with losses to friction, sound, and any heat produced in the collision.
The thought occurred as to what to try to reduce the impact of external torque exerted by the track. One idea was to lubricate the ruler track with some form of greaseless lubricant such as WD-40®.
WD40 was tried. The first complication is the tape no longer holds the tracks in place. This problem proved rather insurmountable. In addition, WD40 wound up everywhere - on hands, table tops, soaked into paper that slid into the WD40. Would need a greaseless lubricant. Even then, the loss of taping ability would remain fatal.
Why not simply use pucks on an air table? Two key reasons. The puck and air table are unfamiliar to students - this raises the probability that the students will, in their own minds, see the whole thing as magic. Another mysterious thing in the modern world. Second, the lab should be as reproducible as possible by any teacher in the nation. The qualitative introduction to the lab requires nothing more than what an instructor on an atoll might be able to get their hands on.
The group work adds two less obtainable items - a stop watch and a mass balance. If a mass balance is not available, then simply treat the duck marbles as being 5 grams each. Some digital watches include a stopwatch or chronograph function. Cell phones also often have a stopwatch function built in.
Marbles on a track are very complex!
Newton's first law is a logical extension of the concepts of the conservation of momentum. Newton's first law simply says that the momentum remains the same. The variable used for momentum is p. Newton's first law is usually applied to single objects where the mass does not change. In this case the velocity of the object stays the same. If the object is at rest, then the object remains at rest. If the object is moving, the the object continues to move. The extension is that the law notes that the motion remains constant provided no external forces act on the object. As Newton said:
Every body persists in its state of rest or of uniform motion in a straight line unless it is compelled to change that state by unbalanced forces impressed on it. - Isaac Newton, Philosophaei Naturalis Principia Mathematica
The tendency of an object at rest to remain at rest, or if in motion to stay in motion, is also referred to as inertia. Inertia can be thought of as the natural resistance an object has to changing its state of motion.
Note that a single mathematical expression p = constant includes both rest (constant = 0) and motion (constant ≠ 0). This "symmetry" is more apparent when one is in constant, unaccelerated motion alongside a moving object. When I run next to a car moving at the same speed as I am running, the car appears motionless relative to me. I would say the car has a momentum of zero. A child sitting in a nahs would say both the car and I have a non-zero momentum.
The somewhat amazing aspect of momentum is that in collisions such as the marble collisions, all observers would say momentum is conserved. Both those sitting at the table and those moving with the speed of the rolling marble. The later observer would say the line of marbles moved backward into the one marble, collided, and "left one behind" stationary relative to the moving observer. If your head hurts a little thinking about this, do not worry, this is normal!
Note the ∆, this means "the change in." There was no change in momentum in the first law. Now there is a change, a change at a constant rate.
Newton's second law builds on the first law. When the momentum changes with respect to time at a constant rate, this rate is called a force. What force is at a basic, fundamental level and how a force comes into existence remains difficult to characterize. Quantum field theory invokes particles to explain force, but that does not help us mere mortals who do not understand quantum field theory understand what a force is at a basic level.
In part one of laboratory four when one marble was rolled into the chain of marbles the force of the impact of the rolling marble was transmitted down the line of marbles to the last marble which then carried the original momentum away from the collision. Just as the "one-in, one out," "two-in, two-out," and "three-in, three out" was in some way mysterious, so too are forces.
Newton himself thought of force as arising out of a change in momentum. Newton used the term quantity of motion for what we now call the momentum p. In Newton's words:
The net force acting on a body is equal to the rate at which the body's quantity of motion is changing.
As was the case with Newton's first law, the mass is often considered to remain the same. Considering mass to be constant and remembering that the momentum p is equal to the mass times the velocity allows for rewriting the second law in the following way:
Where m is the mass of the object, v the velocity of the object, and a the acceleration of the object.
If a force acts on an object, the object will accelerate. In laboratory three the force of gravity acted on the falling ball. The ball fell faster and faster as it fell. The rate of the increase in speed was the acceleration.
As noted above, force is a complex concept. For an object that is free to move, force can cause the object to move and to accelerate. For an object that is not free to move in the direction of the force, the force can still act on the object even though the object is not moving. The study of the application of force to fixed, non-moving structures is called statics.
Forces act on steel beams, bridge spans, building structures, tires, springs, and many other structures. Those forces may include the force of gravity on a bridge, the force of the wind on a building, or the force of the friction with the road on a tire. In each of these cases a counterforce must counter-act the first force or the object will move. While a moving tire may be desirable, a collapsing bridge or a building falling over are not desirable outcomes.
If I lean on the wall, I exert a force on the wall. If the wall did not push back, then I would fall. Imagine a wall made of water, I would simply fall into the wall of water. Water does not push back.
From the above comes the concept of force pairs. For every force that does not produce an acceleration, there is an equal and opposite force acting. This is sometimes said, "For every action there is an equal and opposite reaction." That is not entirely accurate, better to say, "For every force there is an equal and opposite counter-force."
Newton's third law is central to the work done by architects and engineers who use statics to analyze the forces on designed structures to ensure the structures are strong and will not fail.
Instructional notes: Demonstrations have included carrying a ball while coasting on a swizzle board to illustrate frames of reference. When the weather is nice, the class can be wrapped up by a third law demonstration known as a yurt circle outside. The class stands in a large circle and then counts off. The circle must be even, the instructor joins if the class is an odd number. Everyone holds hands or locks wrists. On the count of three those with odd numbers lean in, those with even numbers lean out. Done slowly and carefully, the circle will balance, with everyone off-balance.
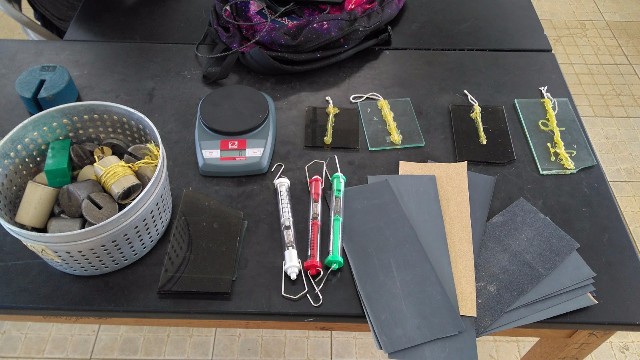
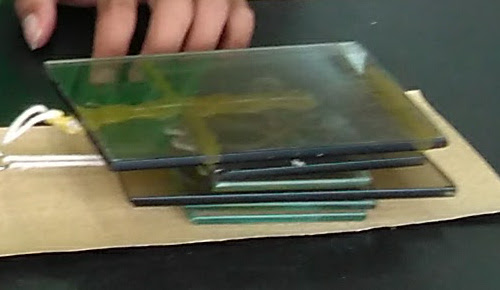
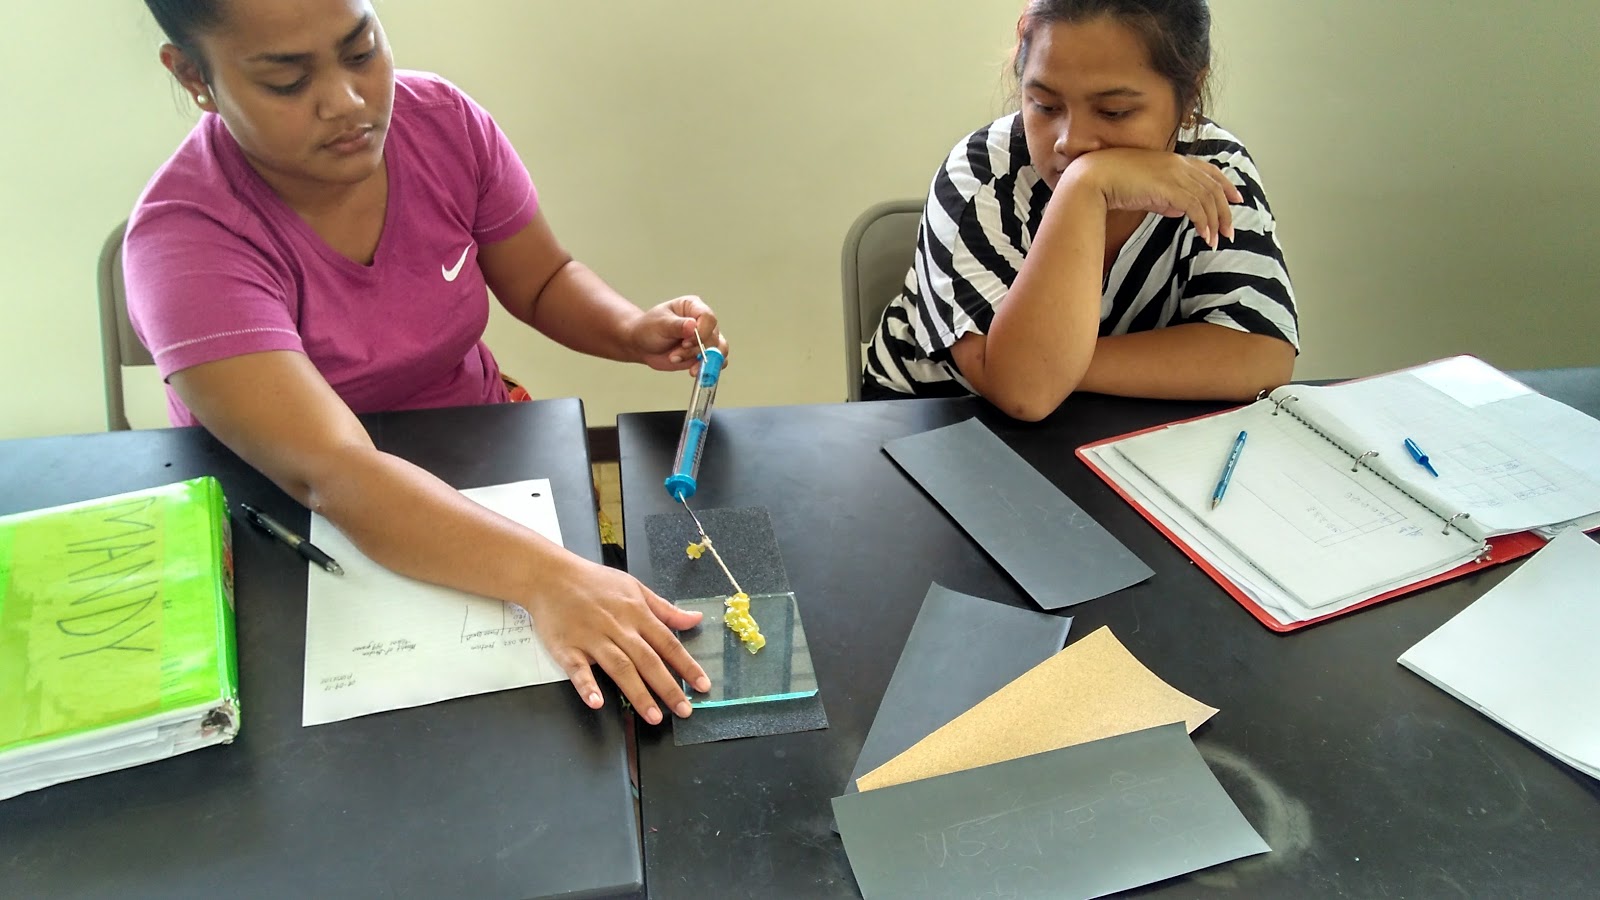
Instructional note: Broken louvers were used to create sleds for this laboratory in Micronesia. These must be handled with care. The upside is that there is no information on the sliding coefficient of glass on sandpaper on line. And the glass does not necessarily behave as might be expected based on information that is on line. The surface area controls for weight by the use of three sleds each consisting of two slabs of glass of different areas glued together with the yoke string in the middle. These three pairs are stacked and flipped in various orders to produce a constant weight sled with different surface areas.
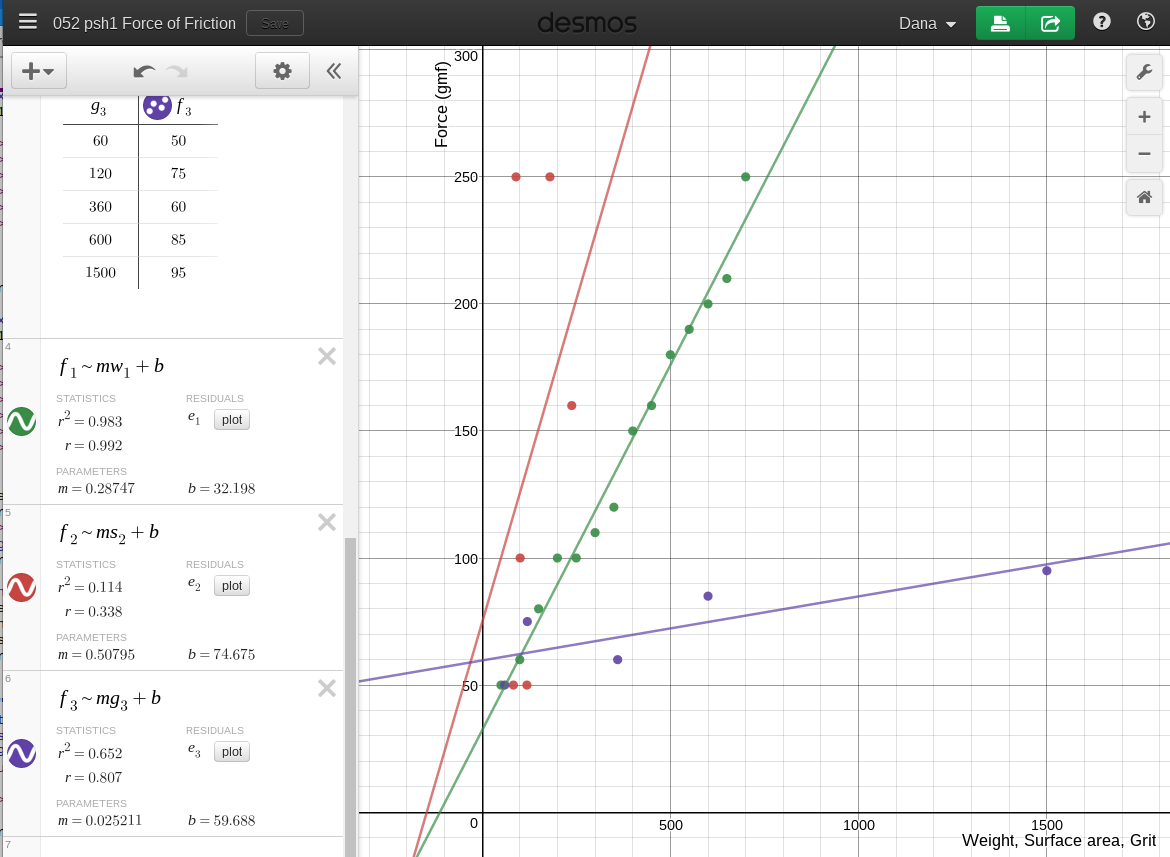
Each group works on their variable, measuring changes in their variable against the force of friction.
Sandpaper grit grades of 60, 120, 360, 600, 1500
Each group works with one of the following tables. Tables may have more or less rows depending on the number of variations of a factor available. Tables can be entered directly into Desmos for those students with the ability to do so. This provides real time feedback on any emerging patterns.
| w1 | f1 |
|---|---|
w1 is mass in grams
f1 is force in gram-force
| s2 | f2 |
|---|---|
s2 is surface area in square centimeters
f2 is force in gram-force
| g3 | f3 |
|---|---|
g3 is sandpaper grit
f3 is force in gram-force
Report whether the data is linear, non-linear, or random. If the data is linear, how good is the fit? What is the nature of the relationship: positive or negative? Does the relationship appear to be a strong or weak relationship? If Desmos is being used and the tables are labeled as above, then the regression equations for each would be: f1~m1w1+b1, f2~m2s2+b2, f3~m3g3+b3
The three slopes will be m1, m2, m3. Slopes near zero may indicate no relationship between the variables. The intercepts will be b1, b2, b3. If the slope is NOT close to zero and the intercept IS close to zero, then there may be a positive relationship for the data in this laboratory.
Discussion the results of your group and of the other groups in the laboratory report.
Instructional note: At the end of the laboratory the students can be asked to work on a brief presentation for the next day in the class. This could be the next lecture day of the class. This provides an opportunity for the teams of scientists to share their findings and explore which factors had the most effect, which had the least effect. In one class the instructor uses this opportunity to introduce the students to looking at the correlation r value displayed by Desmos.

Is there a linear relationship between the extension of an elastic band and force on the elastic band?
Explore the mathematical relationship between force and the lengthening of an elastic band. Hooke's law for steel springs states that Force F = k × distance d where k is a constant called Hooke's constant. Materials that obey this relationship are called Hookean materials.
In this laboratory distances will be measured using centimeters. The force will be measured using grams of mass. When grams are used to express force F, the force F is called a gram-force. One gram-force is the force exerted by a one gram mass at rest on the surface of the planet earth.
Instructional note: If one has no mass balances, simply consider the average mass of a duck marble to be five grams. The error that this will introduce will be small, essentially a linear transformation, and is tolerable in terms of the intent of this laboratory.


Note that the force is technically called a "gram-force" (gmf). Mass is not force, a gram-force is the force exerted by one gram as a result of the acceleration of gravity (980 cm/s²).
| Total distance elastic has stretched (cm) [x] | Force (total mass) of the marbles in the cup (gmf) [y] |
|---|---|
| 0 | 0 |
Make an xy scattergraph of the data.
Wrap up with a discussion appropriate to this laboratory. Discuss whether the system is "predictable," that is, if given a gram-force F could one make reliable predictions of distance d? Do some background research on Hooke's law of elasticity. Look it up on the Internet such as in the Wikipedia. In the conclusion, discuss whether the elastic band is a linear elastic ("Hookean") material.
An interstitial activity
Where is the balancing point: what is the center of gravity?
Then into unreachable cup, stuck to the wall, straight back chair lift: human center of gravity
What happened? Why?
This one requires a demonstration by the instructor.
Who could lift the chair? Who could not? Why could some lift the chair and some could not?
The above activities involve center of gravity. In this activity the center of gravity of an irregular piece of cardboard will be found as an illustration of the center of gravity as the balancing point.
A cantilever is a beam that has one end extending into open space without support. With no weights attached, a meter stick balances in the middle.
The center of gravity for a meter stick with no weights attached is in the middle of the meter stick.
Attach a weight to one end and the fulcrum string has to move to rebalance the meter stick. The left end of the meter stick is termed a cantilever. The force of the weight is keeping the cantilever up. The new center of gravity, center of balance, is at the new location for the fulcrum string.
For the meter stick to balance, the mass of the meter stick to the left of the string must balance the mass to the right of the meter stick. Data was taken for a meter stick that had a mass of 193 g. Masses were used for weights, hence the force is called "gram-force." The table shows the length of the cantilever Lc and the mass m needed to balance that length of cantilever.
Data table
| Lc (cm) | m (g) |
|---|---|
| 50 | 0 |
| 59.5 | 20 |
| 62 | 40 |
| 64.5 | 60 |
| 66.5 | 80 |
| 68.7 | 100 |
| 70.3 | 120 |
| 72 | 140 |
| 73.5 | 160 |
| 74.5 | 180 |
| 75.6 | 200 |
| 76.5 | 220 |
| 77.8 | 240 |
A graph of the above data produces the following chart.
This system is not a direct variation nor a linear equation. The curve above is a section of a rational function.
For a 100 centimeter meter stick, Lc in centimeters, and m in grams hung from the 99 cm point, the governing equation is found by setting the torques equal to each other. ρ is the "linear density" of the meter stick in grams per centimeter of length.
The equation contains information about system. As Lc approaches 99 from zero, the denominator becomes smaller and smaller. This represents the fulcrum string moving toward the mass. The decreasing denominator means that an increasing mass can be supported. As the denominator decreases toward zero, the mass that is balanced by the cantilever increases toward infinity. Of course in the real world the string would break when the total weight exceeded the strength of the string.
At the zero in the denominator the mass would be infinite. This is a vertical asymptote in the function.
Another interesting feature is that below 50 cm the mass goes negative. In other words a lifting force must be applied on the right arm if the cantilever is less than half the meter stick. This also makes sense: with the cantilever less than 50 cm, the right arm is longer and thus produces more force downward. A lifting force, effectively a negative weight, would have to be applied. Note that the equation is calculating force using gram-force.
For the particular meter sticks in use in class, ρ = 1.93. Substituting x for Lc and y for m yields an equation more familiar to an algebra student.
An outline of notes without explanation. To paraphrase what Fermat once scribbled in a margin, the explanations are elsewhere. A concept of discovery science is that the class thrashes out explanations. Better to not cover all of these and give the class some time to ponder the science.
These activity are interstitial activities that usually run on week where a holiday cancels the laboratory.
For any force a counterforce occurs: balloon rocket. Note that the surface of the balloon provides pressure that drives the air out the back of the primitive rocket. Use this as a lead in to the air pressure activities below.
Albezia, being round and rough, does not work as well as a thin flat pine yardstick. Increasing the surface area of the Albezia by using a forked stick or pre-halving the stick may help.
Pressure equals the force per unit area. For an equal application of force, a smaller area exerts a higher pressure due to the inverse relationship for the area.
Solving for the force indicates that larger areas produce more force for a constant pressure.
Occasionally a student will postulate that air in the glass would cause the demonstration to fail. Having some air in the glass does not cause the demonstration to fail. Demonstrate this as necessary. This works with really tall containers. For a bigger mental impact use a larger container.

Source: Tik L. Liem. Science Inquiry Second Edition.

Later: two balloons hanging from a stick
Pulleys are simple machines that lift objects in a variety of ways. The simplest kind of pulley is a grooved wheel around which a rope is pulled. Pulleys can change the direction of an applied force. A combination of fixed and movable pulleys is a pulley system. This is called a block and tackle. A pulley system multiplies applied force to lift heavy objects. Pulley systems are commonly seen on construction sites. In this investigation, each group will use different pulley systems and determine the mechanical advantage of each.
Equipment: pulleys, lines, masses, spring scales
For your pulley system, make a sketch of the pulley(s) and lines. Record the number of lines supporting the load. Starting with a light load, record the force applied to lift the load. Add mass to the load, each time recording the applied force to lift the load. Graph the applied force versus the load. The slope of the trend line is the mechanical advantage for your system.
| Force applied as measured by the spring scale (gmf) [x] | Load (weight) lifted by the applied force (gmf) [y] |
|---|---|
gmf is "gram-force." One gram-force is the force exerted by a one gram mass sitting on the surface of the earth. Using gram-force allows one to record data in "grams" of mass and "grams" of force on the spring scale.
The actual mechanical advantage for your pulley system is the slope of the trendline.
Slope (actual mechanical advantage): ___________________________
The ideal mechanical advantage for your pulley system is the number of lines supporting the load.
Number of lines supporting the load (ideal mechanical advantage): _______________
The ratio of the actual mechanical advantage to the ideal mechanical advantage is the efficiency of the pulley.
efficiency = actual mechanical advantage ÷ ideal mechanical advantage: _______
This report is a full write-up with an introduction, equipment list, procedure, table, labeled xy scattergraph, analysis, and a discussion of the results. The analysis should include the ideal mechanical advantage, the actual mechanical advantage, and the efficiency. The conclusion should include a discussion of results including a discussion of why the actual mechanical advantage differed from the ideal. Cite any sources used in your research on this topic.
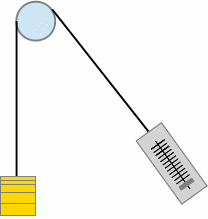
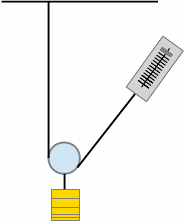
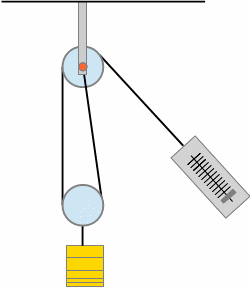
Heat is another form of energy. Previously we worked with potential energy PE, the energy an object of mass mass m possesses for being a height h above a surface in gravitational field g. GPE = mgh. We also worked with kinetic energy, the energy of motion. Kinetic energy KE = 05mv².
There are three way heat energy is transfered (moved).
Temperature is not the same thing as heat. Temperature is a measure of the kinetic energy within the molecules of a substance or fluid. Temperature is related to heat. Heat energy moves from places at a higher temperature to places at a lower temperature.
Water is boiled, water is melted. The temperatures of these events is measured in a demonstration of temperature and explanation of the Celsius system. Other temperatures demonstrated include that of the human body, room temperature, melting solidified coconut oil.
The following was done as a demonstration
What materials are conductors of heat? What materials are insulators of heat? What materials are the best conductors of heat?
The basic set up: hot water in the large cup, room temperature water in the smaller cup.
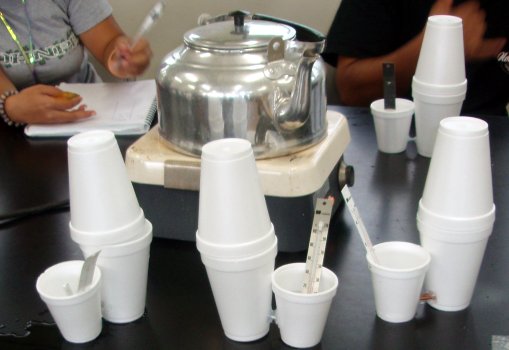
The conductors are hardware store finds: sections of six gage solid copper electrical wire, a zinc wall board fastener, bolts, and other odd bits of materials.
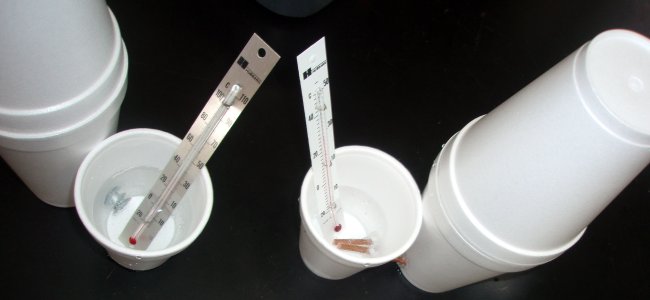
Each group should measure one to two elements.
What metals conducted heat? Which conducted the most heat? Which conducted heat the fastest? How could we best represent the data using a chart?
Instructional note: Have the students work in teams of two on gathering data. Put all of the data on the board. Group pairs of teams to form four to six person groups to work on a chart for a presentation that includes the data gathered in the class. The chart should be able to show all of the materials tested by all the groups. The chart should also show the best and worst conductors. Give these larger discussion groups sufficient time to come up with a chart or graph concept. Have a spokesperson present the concept to the rest of the class.
As a group you will present a chart to the class showing which elements conducted the charts. Your choice on chart type. The instructor may ask questions for clarification on your table and chart designs. There is no one right answer. You are a community of scientists: ask questions.
Use a spreadsheet to produce and hand-in a chart that shows all of the materials and depicts the best and worst conductors.
Have the students record the time in minutes t1versus the temperature in degrees Celsius T1. Plot the data until the temperature holds constant for multiple minutes.
Discuss with the student groups what mathematical models the group members thing might fit their data. Sketches of various possible mathematical models can be provided to the students. The data often produces an "ess" shaped curve that can be modeled using a logistic mathematical model. As the students have likely not studied the base of the natural logarithm e let along logistic curves, this will require a brief explanation. This provides a chance for the students to learn that data has driven models in the past. Logistic and their relatives the sigmoid curves arose in part out of studies of population growth with limited resources. The data drove the development of the mathematical models. The mathematics does not have to come first, the data can lead to a model.
The curve in the image is logistic mathematical model. Desmos distinguishes between lower case t (time) and upper case T (Temperature).
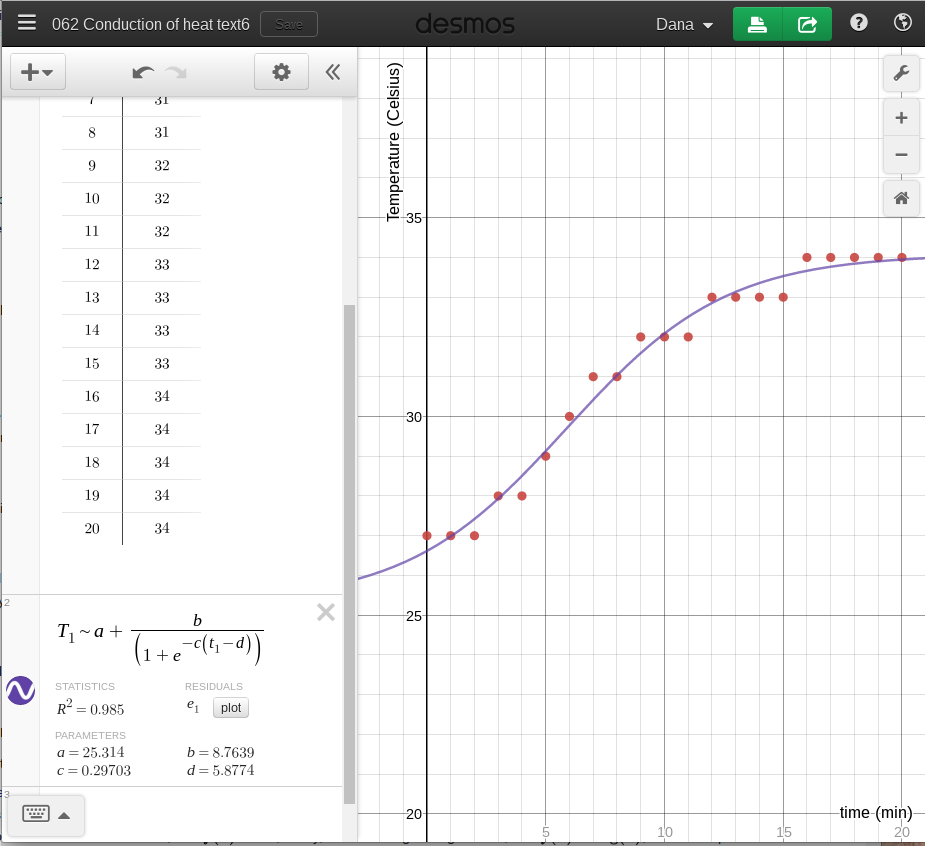
The logistic mathematical model is entered as:
Note that the table header in Desmos uses t1 versus T1:
The laboratory discussion can discuss what is happening physically according to the group's chose mathematical model.
Have the student pour boiling water into an uncovered cup. Record the temperature for up to an hour. The exploration is whether Newton's law of cooling well accounts for the cooling behavior. In the following Desmos formula x1 is the time in minutes, y1 is the temperature in Celsius.
Where T0 is the starting temperature and T1 is the ending temperature. Note that the model fits best if the formula is entered as seen and Desmos is permitted to regress T0, T1, and k. Discussion of results is enhanced by being able to display all of the cooling curves on large monitor. This can be achieved by the instructor entering data into a master Desmos file as the students gather the data.
While Newton's law does not strictly apply to convective cooling, the system is reasonably well modeled by the law.
Instructional note: Monday GPS orientation session so that Wednesday stays focused on latitude and longitude discovery learning and not technical issues with GPS operation.
In this "hide and seek" activity students work in teams to learn about latitude and longitude. The learning model is based on discovery learning. Each team will have a global positioning satellite (GPS) receiver. Students form their own teams based on the number of GPS units.
Garmin eTrex directions, light version. There are five buttons on the eTrex: up arrow (scroll or cycle) up through options, down arrow (scroll or cycle) down through options, enter, page, and power (pwr).
Although the GPS receivers appear identical, some use an older operating system. With the older GPS units you will have to use the compass bearing screen and the down arrow to display the location screen. For the newer GPS units there is an additional screen after the compass bearing screen that can display the latitude and longitude. For all of the GPS units, the compass/bearing screen can display latitude and longitude information. If nothing else: study the directions, play with the buttons. Discover and learn!
If your batteries go dead, see the division administrative assistant for replacement batteries. If the unit does not turn on after holding the "power on" button, then try replacing the batteries. Remember: the unit will only work OUTSIDE.
This game has a 55 minute time limit: one class period. If the instructor is not found by the end of the period, then return the GPS units to the administrative assistant in the division of natural sciences and mathematics. In case you do not find the instructor, Thursday's laboratory is outdoors. Good hunting!
How many meters per arcminute latitude (or longitude)?
What is the conversion factor from metric meters to minutes of arc?
Given that the GPS units can measure differences of 0.001 arcminutes, what is the distance in meters for 0.001 arcminutes?
How close to a location can the GPS unit put a person?
Along a line of latitude, the longitude values increase or decrease.
Along a line of longitude, the latitude values increase or decrease.
Latitude and longitude are measured in degrees and arcminutes. There are 60 arcminutes in one degree. There are 360 degrees in one circle. Note that arcminutes of latitude and longitude are effectively measures of distance not duration, of space not time.
On Earth the equator is 0 degrees latitude. The north pole is north 90 degrees, +90°. The south pole is south 90 degrees, -90°. The equator is half-way between the north and south pole. Pohnpei is located about six degrees north of the equator, almost seven degrees. On the Palikir campus, a global positioning satellite receiver (GPS) will display a latitude value close to N 6° 54.580'. The 54.580' digits are the minutes of arc, the apostrophe is the symbol for minutes. These are not minutes of time, but minutes of space. Arcminutes, also known as minutes of arc, measure an angle. On the Earth's surface, however, an arcminute can be expressed as a distance. Arcminutes are sometimes just called minutes, which can be very confusing!
On Earth the prime meridian is 0 degrees longitude. Pohnpei is located 158 degrees to the east of the prime meridian. The furthest east is 180 degrees. At 180 degrees east one is also 180 degrees west of the prime meridian. East longitude is positive, west longitude is negative. The GPS will display a longitude value near 158° 09.600' on the Palikir campus of the college.
In part one we will work outside. While outside we will use global positioning satellite (GPS) receivers to walk along either a line of latitude or a line of longitude. Lines of latitude run east - west. Lines of longitude run north - south. We will either walk along a line latitude heading due east, or walk along a line of longitude heading due north. Walking east along the line of latitude will cause the longitude value to increase. Walking north on a line longitude will cause the latitude to increase. Here in the FSM these directions, east or north, will keep the slope positive for the relationship between minutes of arc and meters. The other value should be held constant to remain on that line of latitude or longitude.
The latitude or longitude will be determined using a GPS unit. A surveyor's wheel will be used to measure of the distance in meters.
Instructors note: If the surveyor's wheel being used is calibrated in feet, then every one hundred clicks is roughly 30 meters. 100 feet is 30.48 meters which is 1.6% too long. This level of error is an acceptable trade-off given the simplification of the metric data values. Depending on the start location, on the Palikir campus one can measure 120 to 150 meters along a line of latitude in the area north of the A and B classroom buildings. Other sites would have to make their own local decision on whether to measure along a line of latitude or longitude. A conversion table with conversions for 30, 60, 90 meters... can also be used to cope with non-metric measuring equipment.
Latitude/longitude value held constant:_________ ° ______.____________'
Starting longitude/latitude:_________ ° ______.____________'
In the following table record the change in arcminutes of latitude (or longitude). To do this, read the degrees and arcminutes shown on the GPS and subtract the start value recorded above. To keep the relationship positive in Micronesia, walk North or East. If doing a line of latitude on the Palikir campus, start at the main parking lot and walk East.
Subtracting the start value sets the y-intercept to zero and yields a direct relationship.
| a1 | d1 |
|---|---|
| 00.000 | 0 |
| ______.____________ | 30 |
| ______.____________ | 60 |
| ______.____________ | 90 |
| ______.____________ | 120 |
| ______.____________ | 150 |
| ______.____________ | 180 |
| ______.____________ |
a1: Change in distance (arcminutes)
d1: Change in distance (meters)
Some smart phones apps report latitude and longitude information from a built-in GPS in decimal degree format. If working with with decimal degrees the app may report values to a fifth decimal place, 1/100,000th of a degree. The data when graphed will yield the meters per degree, which could be multiplied by 360 to estimate the circumference at that latitude or longitude.
Plot the arcminutes a1 versus the meters d1 using Desmos. Add a the linear regression d1~ma1
Report the line of latitude/longitude that was held constant, the line the students walked along. Report the starting longitude/latitude. The slope is the number of meters per arcminute. This represents the number of meters one has to go to travel one arc minute on the earth's surface. Report the slope with the units - the conversion factor has units meters/minute.
The analysis should include latitude which was held constant, starting longitude, ending longitude, and the slope which is the conversion factor for moving between arcminutes and meters.
The meters per arcminute indicates the number of meters to move one minute of arc over the surface of the earth. The GPS measures minutes to three decimal places, one-one thousandth of a minute of arc. If the distance between two locations is smaller than one-one thousandth of a minute of arc, then the GPS cannot distinguish between the two places. How many meters must one move in order to change the minutes by 0.001'?
The answer to the question, "How many meters must one move in order to change the minutes by 0.001'?" is key to answering how close to a location can a GPS put one? How close can the coordinates given in the hide and seek exercise put one to the target? Discuss these questions and their answers.
If you can determine the correct value of meters per arcminute for the location at which the laboratory was done, that value can be used to estimate the percentage error between the experimentally measured value and the expected (published) value. The error can be reported and discussed.
In part two, power, Internet, and lab access permitting, the class will use Google Maps or Google Earth. Google Maps is accessible from any browser and can be commanded to display the distance walked in meters. Google Earth will also be used to show the equator and prime meridian. The location of 071 GPS hide and seek can also be displayed. Use of Google Earth as an educational tool for exploration and learning is also covered. Edutainment geolearning sites like GeoGuessr might also be presented.
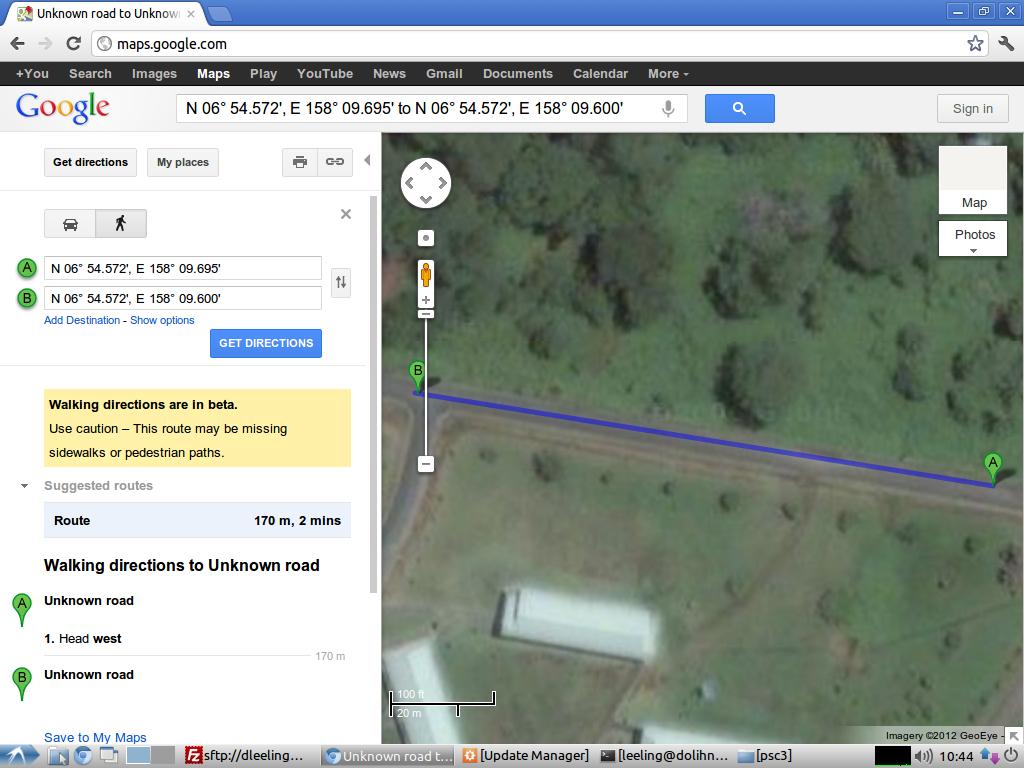
the students should be encouraged to engage in open exploration.
If Google Earth is available, then Google Earth has a ruler feature that can measure in meters.
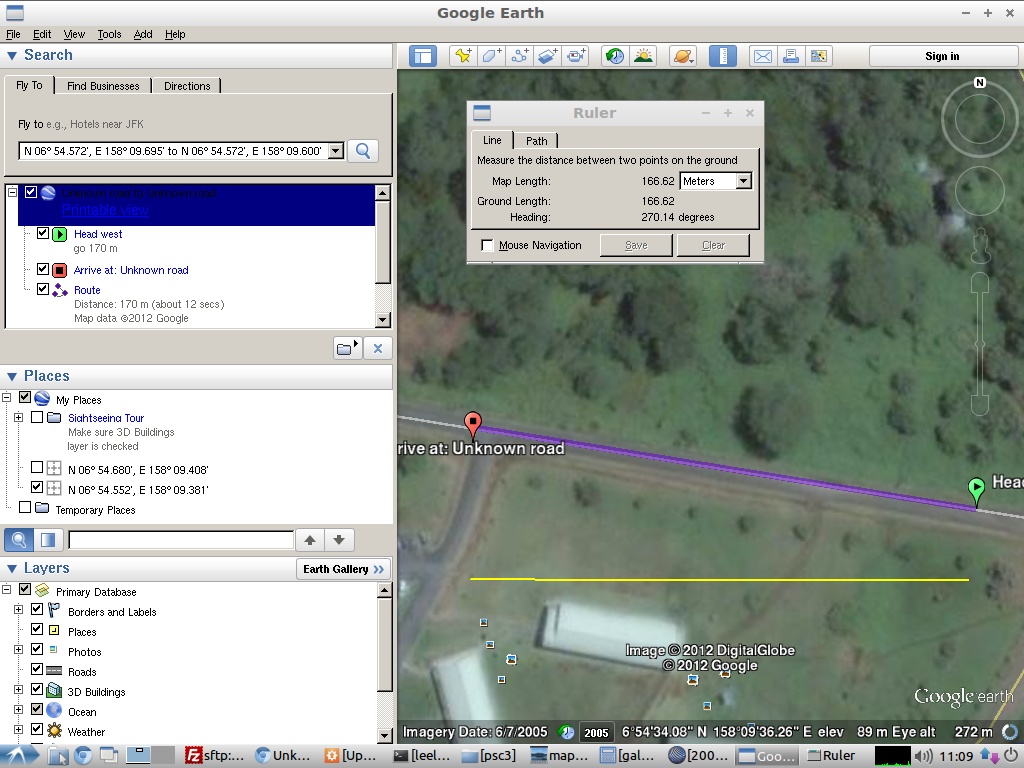
The class starts off with a demonstration of calculating the relative humidity, heat index, and risk level for activity using a wet and dry bulb thermometer. Tables based in part on the heat index calculator.
Other weather calculators.
Relative humidity from dry bulb and wet bulb depression:
| Web bulb depression in °C: Dry bulb minus the wet bulb | ||||||||
|---|---|---|---|---|---|---|---|---|
| Dry bulb T in °C | 0.5 | 1.0 | 2.0 | 2.5 | 3.0 | 3.5 | 4.0 | 5.0 |
| 21 | 95% | 90% | 83% | 79% | 77% | 72% | 67% | 60% |
| 24 | 96% | 91% | 84% | 80% | 78% | 74% | 69% | 62% |
| 27 | 96% | 91% | 85% | 81% | 78% | 75% | 71% | 65% |
| 28 | 96% | 93% | 85% | 82% | 78% | 75% | 72% | 65% |
| 29 | 96% | 93% | 88% | 84% | 80% | 76% | 73% | 66% |
| 30 | 96% | 93% | 88% | 84% | 81% | 76% | 73% | 67% |
| 32 | 96% | 93% | 89% | 85% | 81% | 78% | 74% | 68% |
| 35 | 96% | 93% | 89% | 85% | 82% | 79% | 75% | 69% |
| 38 | 96% | 93% | 89% | 86% | 83% | 80% | 76% | 71% |
Heat index as an effective temperature in °C given a dry bulb temperature and Relative Humidity:
| Dry bulb temperature in °C | |||||||||
|---|---|---|---|---|---|---|---|---|---|
| Relative humidity | 21 | 24 | 27 | 28 | 29 | 30 | 31 | 32 | 35 |
| 60% | 21 | 24 | 28 | 29.5 | 32 | 33 | 35 | 38 | 46 |
| 70% | 21 | 25 | 29 | 30.7 | 34 | 35 | 37 | 41 | 51 |
| 80% | 22 | 26 | 30 | 32.1 | 36 | 38 | 40 | 45 | 58 |
| 90% | 22 | 26 | 31 | 33.7 | 39 | 41 | 43 | 50 | 64 |
| 100% | 22 | 27 | 33 | 35.6 | 42 | 44 | 49 | 54 | 72 |
| Effective temperature in °C: | Risk level |
|---|---|
| Less than 32 °C | Low risk: Safe to exercise with proper hydration |
| 32 °C to 41 °C | Moderate risk: Heat cramps or heat exhaustion likely |
| Above 41 °C | High risk: Heat stroke likely. |
Discuss the implications for runners and other athletes in Micronesia
Warm air rises (convection) and cools. Cooler air holds less water than warmer air. The result is that water condenses out of the air as the air rises. This condensation is visible as clouds. Condensation requires dust, smoke, or other microscopic airborne particles for the water to condense upon. As a result of this condensation, precipitation can occur. Precipitation is produced by three different processes, although the first process is dominant in Micronesia.
Other notes
Types of Precipitation
Rain, snow, sleet, hail, dew (radiative cooling), or fog. Radiation fog.
Supercooled water, ice necessary to lightning, thunder. Distance versus time. 330 m/s, about three seconds per kilometer. So divide by three to get distance in kilometers. No shelter under trees! Squat. Stay in car.
Air masses:
Two. Maritime equatorial mE air mass ("doldrums" for lack of wind) most of the year. Jan-Feb ("trade wind season") maritime tropical mT air mass.
No warm and cold fronts. Pressure waves along the equator, local heating effects.
InterTropical Convergence Zone: ITCZ
Tropical storms
Areas of organized convection
Tropical depression (Get numbered!)
Requirements: SST > 28 C, low vertical shear, high pressure anti-cyclone aloft
| CATEGORY | DESCRIPTION | MAX SUSTAINED WINDS | PEAK GUSTS |
|---|---|---|---|
| TROPICAL DEPRESSION AND TROPICAL STORM CATEGORIES | |||
| Tropical Storm Category A | Weak Tropical Storm | 26-43 knots (30-49 mph) | 33-56 knots (40-64 mph) |
| Tropical Storm Category B | Severe Tropical Storm | 44-63 knots (50-73 mph) | 57-81 knots (65-94 mph) |
| TYPHOON and SUPERTYPHOON CATEGORIES | |||
| Typhoon Category 1 | Minimal Typhoon | 64-82 knots (74-95 mph) | 82-105 knots (95-120 mph) |
| Typhoon Category 2 | Moderate Typhoon | 83-96 knots (96-110 mph) | 106-121 knots (121-139 mph) |
| Typhoon Category 3 | Strong Typhoon | 97-113 knots (111-130 mph) | 122-144 knots (140-165 mph) |
| Typhoon Category 4 | Very Strong Typhoon | 114-134 knots (131-155 mph) | 145-171 knots (166-197 mph) |
| Typhoon Category 5 | Devastating Typhoon | 135-170 knots (156-194 mph) | 172-216 knots (198-246 mph) |
El Niño (and La Niña)
Westerly wind burst
Surface layers slide west
Convection moves west
SUNGLASSES DAY! Bring your sunglasses today! Weather permitting we will be observing clouds.
How accurately can you draw a specific type of cloud?
What am I?
I bring fresh showers for the thirsting flowers,
From the seas and the streams;
I bear light shade for the leaves when laid
In their noonday dreams.
From my wings are shaken the dews that waken
The sweet buds every one,
When rocked to rest on their mother's breast,
As she dances about the sun.
I wield the flail of the lashing hail,
And whiten the green plains under,
And then again I dissolve it in rain,
And laugh as I pass in thunder.
I sift the snow on the mountains below,
And their great pines groan aghast;
And all the night 'tis my pillow white,
While I sleep in the arms of the blast.
Sublime on the towers of my skyey bowers,
Lightning, my pilot, sits;
In a cavern under is fettered the thunder,
It struggles and howls at fits;
Over earth and ocean, with gentle motion,
This pilot is guiding me,
Lured by the love of the genii that move
In the depths of the purple sea;
Over the rills, and the crags, and the hills,
Over the lakes and the plains,
Wherever he dream, under mountain or stream,
The Spirit he loves remains;
And I all the while bask in Heaven's blue smile,
Whilst he is dissolving in rains.
The sanguine Sunrise, with his meteor eyes,
And his burning plumes outspread,
Leaps on the back of my sailing rack,
When the morning star shines dead;
As on the jag of a mountain crag,
Which an earthquake rocks and swings,
An eagle alit one moment may sit
In the light of its golden wings.
And when Sunset may breathe,
from the lit sea beneath,
Its ardors of rest and of love,
And the crimson pall of eve may fall
From the depth of Heaven above,
With wings folded I rest, on mine aery nest,
As still as a brooding dove.
That orbed maiden with white fire laden,
Whom mortals call the Moon,
Glides glimmering o'er my fleece-like floor,
By the midnight breezes strewn;
And wherever the beat of her unseen feet,
Which only the angels hear,
May have broken the woof of my tent's thin roof,
The stars peep behind her and peer;
And I laugh to see them whirl and flee,
Like a swarm of golden bees,
When I widen the rent in my wind-built tent,
Till the calm rivers, lakes, and seas,
Like strips of the sky fallen through me on high,
Are each paved with the moon and these.
I bind the Sun's throne with a burning zone,
And the Moon's with a girdle of pearl;
The volcanoes are dim, and the stars reel and swim
When the whirlwinds my banner unfurl.
From cape to cape, with a bridge-like shape,
Over a torrent sea,
Sunbeam-proof, I hang like a roof,--
The mountains its columns be.
The triumphal arch through which I march
With hurricane, fire, and snow,
When the Powers of the air are chained to my chair,
Is the million-colored bow;
The sphere-fire above its soft colors wove,
While the moist Earth was laughing below.
I am the daughter of Earth and Water,
And the nursling of the Sky;
I pass through the pores of the ocean and shores;
I change, but I cannot die.
For after the rain when with never a stain
The pavilion of Heaven is bare,
And the winds and sunbeams with their convex gleams
Build up the blue dome of air,
I silently laugh at my own cenotaph,
And out of the caverns of rain,
Like a child from the womb,
like a ghost from the tomb,
I arise and unbuild it again.
- Percy Bysshe Shelley (1792-1822)
In previous laboratories we have explored mathematical models, physical processes, and hypothesis testing. Laboratory eight has a different focus. Laboratory eight focuses on observation and recording in a scientifically accurate manner what is seen. Science has many fields that focus on careful observation and labeling. The ability to observe and accurately record observations are valuable scientific skills. Science has long depended on accurate and careful drawings of objects and phenomenon. This laboratory focuses on observation of clouds and attempting to accurately depict a cloud.
Hamlet: Do you see yonder cloud that's almost in shape of a camel?
Polonius: By the mass, and 'tis like a camel, indeed.
Hamlet: Methinks it is like a weasel.
Polonius: It is backed like a weasel.
Hamlet: Or like a whale?
Polonius: Very like a whale.
- Hamlet, Act iii Scene 2, William Shakespeare, 1602
Clouds video playlist at YouTube
Prior to 1800 clouds were seen as ephemeral, ever changing, impermanent, and thus difficult to categorize or name. In 1802 an Englishman named Luke Howard developed a systematic way to name clouds. Impressed by the Latin naming system designed by Carl von Linné for classifying plants and animals, Howard devised a Latin-based language system for classifying and naming clouds. Howard's system made sense to scientists. With some modifications, this is the system the world uses to this day. The descriptions are Howard's original descriptions.
Howard extended his system with descriptions for unusual types of clouds.
One modification has been to add a prefix to the middle and high level clouds. Thus we now speak of altocumulus, altostratus, and cirrostratus clouds. Alto- refers to middle level clouds, cirro- to the highest level clouds. Low clouds get no prefix. Some clouds have bottoms at the low level and tops at the high level. These are vertically developed clouds and usually produce precipitation. These clouds are usually cumulonimbus clouds, a term that combines two of Howard's cloud terms. You and I think of the largest cumulonimbus as clouds that produce heavy rain, wind gusts, and occasional lightning and thunder.
Here on Pohnpei the top of our ridges are 700 to 800 meters high (2000 to 2500 feet). The bottoms of cumulus clouds are often also around this high. Cloud bottoms can be lower, and when the cloud reaches the ground the term used is "fog."
A second modification is that Howard's extended cloud names are often now used to modify one of the four basic cloud types. Cumulus humilis and cumulus congestus are examples of this naming system.
Each student will produce as accurate a drawing of actual clouds as the student can accomplish. Here the goal is observing carefully and trying to accurately capture a realistic image the major cloud types. The drawing should include cumulus humilis, cumulus congestus, cumulus castellanus, altocumulus, and cirrus. Lab partner pairs will have to share an art set kit.
Initially we will observe clouds as carefully as we can, making any necessary sketches on eight and half by eleven paper before returning to the lab room to work on actual drawings. Drawings will be finished in class. Turn in your drawing. Note that the drawing is marked against a rubric.
Instructional note: This laboratory is accompanied throughout the term by occasional cloud spotting exercises starting from the first day of class. On days when the sky presents a useful mix of cloud types, the class goes outside for a few minutes at the start of class and is shown the various cloud types present. After this laboratory, the outside forays are done as a "cloud quiz" where students have to correctly identify the cloud type pointed out by the instructor in a written "pop quiz."
Among all animals, only humans appear to attempt to name objects in their surroundings. Western science has spent a great deal of effort on naming and classifying objects and phenomenon. Western science is not the only system that has produced naming and classification systems.
All cultures have weather words. Words such as sky, cloud, fog, rain, wind, thunder, lightning, morning dew, storm, typhoon, and rainbow. Think about your own language. Is there only one word for each or many words? In English rain words include drizzle, mist, downpour, precipitation, shower, and deluge. Lightning is described sometimes by modifier words such as bolt, spear, and flash. Thunder includes variations such as "rolling thunder." Is there more than one kind of cloud? Do the languages of Micronesia include such distinctions?
The following are some of the weather words in some parts of Micronesia listed from east to west.
| English | Kosrae | Pohnpei | Nukuoran | Chuukese | Yapese |
|---|---|---|---|---|---|
| cloud | puhkuhnyeng | depwek | hagausinga | kuchu | magoleng |
| dew | aun fong | pwoaik | malulu o laiao | chiichiin foun ran | |
| downpour | af sranom | kotou mosul | maadolu de langi | punguchow | |
| fog | ohu | toahkoi | hagausinga ba iho | patapaten atuet | |
| lightning | sahrom | lioal | wila | merefi | uluch |
| mist | af sringsring | kerekerin kotou | amoranipwiin | spagun gun | |
| rain | af | kotou | langi | raan | n'uw |
| rainbow | lelahkwem | iahia | umada | reesim | ragim |
| thunder | puhlahl | NanSapwe | hatuli | chopunap | dirra' |
| typhoon | fohru | melimel | menumen | yakko | |
| wind | eng | kisinieng | madangi | akasepwan | nifeng |

As an option for introducing waves one can ride a caster board across a wet towel with food color and then across two large sheets of paper such as easel paper used for presentations. Timing the run provides the ability to calculate frequency and period data. With practice, the wheels leave behind sine waves
Equipment
A ball being bounced is a good example of a repeating system. In physics, repeating systems are described by special terms. When the ball repeatedly returns to a previous position and velocity, each repeat is called a cycle. A system that repeats is also known as an oscillating system.
The duration in time for one cycle is called a period τ. Period is often calculated by timing many cycles. Divide the time by the number of cycles to get the period. The units for period are seconds per cycle.
The mathematical reciprocal, dividing the number of cycles by the time, is called the frequency f. The units for frequency are cycles per second. Cycles per second has a special name: Hertz. One Hertz is one cycle per second.
If the distance the ball is dribbled is small (short), the then frequency f is high.
If the distance the ball is dribbled is large (long), the then frequency f is low.
Instructional note: Demonstrate using a stop watch, timing ten to twenty cycles (dribbles). Calculate both the period and frequency.
In the diagram above:
Amplitude and wavelength are measures of space. Waves have a time component as well. The time component of a wave is the frequency.
In 1864 James Clerk Maxwell wrote, "For the sake of persons of different types of mind, scientific truth should be presented in different forms and should be regarded as equally scientific whether it appears in the robust form and vivid colouring of a physical illustration or in the tenuity and paleness of a symbolic expression." The Scientists, John Gribbin, page 429. Library, Amazon.
Physics first studied the physical world that we can see, hear, and touch. As physics studied both larger systems - such as the universe, and smaller systems, such as atoms, the physical models imagined became more of a mental picture our mind can comprehend than the actual reality. A theory called string theory imagines the universe consisting of what are mathematically not unlike vibrating strings, yet the reality - if string theory is true - is simply beyond our imagination. The only "reality" - if any - are the mathematical equations that describe the system. Nature is mathematical.
When time and space combine linearly, the result may be a velocity. Waves have a velocity. The velocity v for a wave is calculated by multiplying the wavelength λ by the frequency f.
Velocity of a water wave in shallow water where g is the acceleration of gravity and d is the depth of the water.
Instructional notes: Using a meter stick and stopwatch demonstrate the relationships between frequency f and wavelength λ. Diagram the wavelength and amplitude on the board. Calculate the velocity v of a wave on a chain. Cover the connections to sound waves, water waves.
Instructional note: This lab may take quite a bit of time to gather data in between rain showers. Rain makes hearing the sound difficult. The experiment can usually only proceed in between rain showers.
Laboratory objective: To measure the speed of sound (also known as Mach one).
Where there is the linear space to utilize this procedure, this procedure produces the most accurate data. Speed of sound values generated are usually within 5% and can be within 1% of the actual speed of sound on that day. Note that the use of the median for 25 or more time measurements is part of the reason this procedure produces such accurate results. Hand or arm signals enhanced by a towel can be used to communicate. A spinning towel is often used to tell a clapper to "clap again." If available, the ability to use cell phones is a plus when more complex communications are necessary. To direct a unit to take cover due to weather, cell phones are often useful.
The echo flight distance is the distance out-and-back to the surface off of which the echo bounces.
Temperature: __________℃
Data table for direct measurement
| t1 | d1 |
|---|---|
| 0 | 0 |
| 200 | |
| 250 | |
| 300 | |
| 350 | |
| 400 | |
| 450 | |
| 500 | |
| 550 |
t1 Median time (s)
d1 is the Distance (m)
Echo procedure A
| Location on campus | Time for 30 claps (s) | Time for one clap (echo travel time) (s) [x] | Echo flight distance (m) [y] |
|---|---|---|---|
Data table for echo procedure B
| Location on campus | Duration (s) | Claps | Time for one clap (echo travel time) (s) [x] | Echo flight distance (m) [y] |
|---|---|---|---|---|
| 10 | ||||
| 10 | ||||
| 10 | ||||
| 10 | ||||
| 10 | ||||
| 10 | ||||
| 10 | ||||
| 10 | ||||
| 10 | ||||
| 10 |
For the direct measurement, time t1 will be on the x-axis, and the distance d1 will be on the y-axis. For the echo procedures, make an xy scatter graph of the echo travel time [t1] versus the echo flight distance (d1).
The data is likely to be linear. Use the relationship d1~vt1 in Desmos to obtain the speed of sound v.
The graph is a time (duration) versus space (distance) graph, the slope is the speed of sound.
The speed of sound varies primarily as a function of temperature. Use the temperature to determine the speed of sound in air at the time of the laboratory. To make this calculation look up the published speed of sound in air using a site such as HyperPhysics after the laboratory session is over. Cite your source using either APA or MLA.
Perform an error analysis on the experimental value for the speed of sound from your slope calculations versus the published speed of sound. Calculate a percentage error as well: (experimentally measured − published)/published. Do NOT forget the parentheses.
Write up a discussion of the laboratory including a discussion of the results, the theoretic predictions, whether the experimental data agrees with the theory and how good that agreement might be, and potential sources of error. Anything less than 5% is excellent agreement, less than 10% is good agreement.
Instructional note: Spectrometers made from boxes and CDs were used. Both the continuous solar spectrum and a discrete fluorescent light spectrum were observed by the students.
Traditional colors of the visible spectrum in English: Red Orange Yellow Green Blue Indigo Violet. Indigo was apparently inserted by Newton to have seven colors in the "rainbow" as opposed to six.
Below red: infrared heat radiation. Microwaves. Radio waves. Alternating current.
Beyond violet: ultraviolet. Can cause sunburn, skin cancer. Even higher frequencies include x-rays and cosmic rays (cosmic radiation).
If gas discharge tubes are available, a demonstration of continuous versus discrete spectra can be done.
A rainbow is a continuous spectrum produced by the sun. All of the colors "blur" into the next color, there are no distinctive separations in the colors. The sun produces light as a result of being very hot. Things that produce light by getting hot produce continuous spectra.
A gas discharge tube contains one specific gas. Gases produce discrete spectra. The colors do not blur into each other but are separated by gaps where no color appears. Gases with a small atomic number such as hydrogen and helium clearly show separated spectral lines. The lines are related to the nature of the atomic structure of an atom. Atomic structure is a part of a later chapter in this text.
What are the primary colors of light? What are the secondary colors of light? How is color produced by monitors, cell phone screens, lap top computer screens, and televisions? What is your favorite color and why?
In this three part laboratory we will explore the colors of light and systems of organizing colors. In the first part of this laboratory we will look at how televisions and monitors produce the colors of the rainbow. In the second part we will learn about hue, saturation, and luminosity. Finally we will learn some color keywords specific to the world of computers and the world wide web.
![]()
Rainbows are a blend of colors that run from purple to red. Rainbows are caused by refraction and internal reflection in a raindrop. Although the colors blur into each other, rainbows appear to have six distinguishable colors in English: red, orange, yellow, green, blue, and violet. Newton's opinion was that there were seven colors: red, orange, yellow, green, blue, indigo, and violet.
Yet television screens, cell phone screens, and computer monitors can produce all the colors of the rainbow using just three colors of light. All colors can be produced with only three colors of light: red, green, and blue (RGB). Red, green, and blue are called the primary colors of light. In this laboratory we will use HTML code to control the colors of light on a computer monitor.

A five by four grid of 20 pixels
The screen has millions of sets of tiny picture elements called pixels. Pixel is short for picture element. Each pixel is comprised of three color phosphors, one of each of the primary colors of light: red, green, and blue. Commands to set a particular pixel color are issued as a three digit base 16 (hexadecimal) number. The first digit indicates how bright to make the red phosphors, the second digit indicates how bright to make the green phosphors, and the third digit indicates how bright to make the blue phosphors.

Green plus on white background
The brightness of phosphor is set by a number. Zero is all the way off. Sixteen is all the way on, full on. Computers, however, do not count in base ten. Our computers work in base 16. Base 16 is called hexadecimal. The problem is that base ten has no single digit "number" symbols for the numbers from 10 to 15. So in hexadecimal the letter A is used for "10", B for "11", C for "12", D for "13", E for "14", and F for "15". The number after F is "one sixteen and zero ones" which is written "10".
The following table shows the base ten number and the corresponding hexadecimal numbers.
| Base 10 | 0 | 1 | 2 | 3 | 4 | 5 | 6 | 7 | 8 | 9 | 10 | 11 | 12 | 13 | 14 | 15 | 16 |
|---|---|---|---|---|---|---|---|---|---|---|---|---|---|---|---|---|---|
| Base 16 | 0 | 1 | 2 | 3 | 4 | 5 | 6 | 7 | 8 | 9 | A | B | C | D | E | F | 10 |
The colors on a computer screen can be controlled by a hexadecimal number between 0 (off) and F (full on), with 8 being half way on.
| Hex | Phosphor dot status |
|---|---|
| 0 | off |
| 4 | quarter of full brightness |
| 5 | about one third of full brightness |
| 8 | half of full brightness |
| A | about two-thirds of full brightness |
| C | three-quarters of full brightness |
| F | full brightness for that color |
Getting the computer to actually process the color number command will require enclosing the command in a simple program. We will use HTML to work with our colors.
To write and display the HTML, use the onlinehtmleditor.net site. This will allow one to see the results of edits immediately.

Alternatively, if for some reason the Internet is not available, write the HTML with a text editor.
Instructional note: The writing of the HTML code is usually done first as a demonstration by the instructor. On Ubuntu the default text edit is gEdit, Lubuntu uses Leafpad, and Windows has Notepad. On ChromeOS the Chrome app Caret is highly recommended by the author. The demonstration includes how to save the web page code. When using Notepad, change the file type to All Files or Notepad will append a .txt filetype extension. Opening the web page with a browser is also demonstrated. Using Ctrl-o for "open" works in most browsers except on Apple where Cmd-o is used. The instructor may also demonstrate resizing the text editor and browser window so both use half the screen. This permits both to be open. The student can then save in the editor and immediately refresh in the browser.
In the text editor you will have to type the code shown exactly as it is typed in the example below.
<html>
<head>
<style>
body {background:#F00}
</style>
</head>
<body>
<p>Text</p>
</body>
</html>
The "#" in front of the "F00" tells the computer that a hexadecimal number is being used. Note that the f can be lowercase f or uppercase F. #F00 is "red full on, green off, blue off. The "00" are the digits "zero zero" not the capital letter "O"
Computers are very literal: the code must be identical to the code above. Any error, even a single letter wrong, will cause your web page to fail. After typing the code exactly as seen above, save your file as an HTML file.
![]()
Type the file name into the first blank in the dialog box. Call the file "labten.html" The file can be saved to the location of your choice: the Documents folder or a USB flash drive. If using Microsoft Windows Notepad, set the file type to All Files before saving. On ChromeOS save to the Downloads folder. Remember where you chose to save the file!
Open a web browser such as Google Chrome, Safari, or FireFox. Use Ctrl-o open the saved file. Locate the saved file and open the file.

Use the editor to change the color command. Once open change the color to #0F0 and then choose File:Save (NOT Save as...!).
![]()
After doing this, return to the browser and click on the refresh button (Ctrl-r)to update the web page with the #0FO code. #0FO is red off, green full on, blue off.
Change the background color to the following hexadecimal numbers to see what color results.
RGB is how computers display colors, but try to imagine what combination produces orange, pink, baby blue, sea blue, or brown. Our brains do not think well in RGB. The next system is a system that uses a color wheel to organize the colors in rainbow order, controlling the amount of color and brightness with two percentages.
The primary colors of light are red, green, and blue.
The secondary colors of light are yellow, cyan, and magenta.
| Closest hue name | Hue angle |
|---|---|
| red | 9 |
| orangered | 17 |
| orangered | 24 |
| orangered | 24 |
| darkorange | 26 |
| orange | 30 |
| orange | 36 |
| orange | 43 |
| goldenrod | 48 |
| gold | 52 |
| yellow | 64 |
| greenyellow | 77 |
| chartreuse | 88 |
| lime | 111 |
| springgreen | 137 |
| aquamarine | 165 |
| cyan | 184 |
| deepskyblue | 200 |
| royalblue | 217 |
| blue | 230 |
| blue | 236 |
| blue | 239 |
| slateblue | 250 |
| indigo | 270 |
| purple | 303 |
Another way to describe color is by using a color wheel or color circle. The word hue is used for the word color when working with a color wheel. On a color wheel the colors are arranged in a circle in the same order that the colors appear in a rainbow. The primary colors of light, red, green, and blue, are spaced evenly around the color wheel. The hues are specified by their angle around the 360° hue wheel.
The hues are arranged in rainbow order.
Red, the first color in the rainbow, is placed at the top and is assigned a color angle (or hue angle) of 0°.
Once around a circle is 360°.
Green is placed one third of the way around the circle at 120°.
Blue is placed two-thirds of the way around the circle at 240°.
On the right are the hue angles for colors taken from measurements of the hue angles for pixels in an actual image of a rainbow. The color names are approximate X11 color names from part III of the lab. For many of the hue angles there is no exactly matching X11 color of appropriate hue, saturation, and luminosity.
Saturation is how much of a hue is displayed. Zero percent saturation is no color. Zero saturation results in black, grays, or white. The maximum saturation is 100%. At a saturation of 50% the color is tinged with a grayishness but is distinctly of a hue.
Luminosity is how bright, how luminous, the color should be. Zero percent results in black, while 100% makes the color so bright that it appears white. 50% yields the "purest" colors to the human eye, above 50% and the brightness starts to wash out the color.
The color command is hsl for hue, saturation, and luminosity. The command structure is:
hsl(0 to 360,0% to 100%,0% to 100%)
The first number is the hue angle on the color wheel, the second number is the saturation in percent, and the third number is the luminosity in percent. Try the following code, do not forget the percentage signs. Do NOT put any spaces in the "hsl(0,100%,50%)" color command.
<html>
<head>
<style>
body {background:hsl(0,100%,50%)}
</style>
</head>
<body>
<p>Text</p>
</body>
</html>
The primary colors of light are spaced evenly one-third of the way around the color circle with red at 0°, green at 120°, and blue at 240°. Half way in-between are the secondary colors of light yellow at 60°, cyan at 180°, and magenta at 270°. You might recall that yellow is also #FF0: full on red, full on green. What primary colors are turned on full for cyan and magenta?
The newest variation of HSL is HSLA, where the A stands for "alpha". Alpha specifies the level of transparency for a color. A sample HSLA web page with a Halloween theme. An HSLA color command looks like:
hsla(30,100%,70%,.55)
where the last number is the transparency. Zero is fully transparent, one is opaque color. Numbers in-between are partially transparent.
No culture uses numbers for colors. People use color words such as red, yellow, green, cyan, blue, and magenta. A page at Luminoso details graphically the results of an XKCD color survey that explored names of colors. There are gender differences in color preferences.
In the world of web pages there are X11 color names. The list at the end of the lab is the X11 color names in hue angle order. The hue angle is given for reference. Note that the color command in the style section controls the color of the text.
<html>
<head>
<style>
body {background:linen;
      color:saddlebrown}
</style>
</head>
<body>
<p>Text</p>
</body>
</html>
X11 color names are popular because they are easy to remember. Critics note that the color names are in English and that the naming system is not logical nor consistent.
Web pages often include headings, images and links. Although no web page author would do so, the style commands below include all three computer color systems.
<!DOCTYPE html>
<html lang="en">
<head>
<meta charset="UTF-8">
<title>Page title</title>
<style>
 body {background:#FEF;
       color:hsl(240,100%,50%)}
 h1 {color:indigo}
</style>
</head>
<body>
<h1>heading level one</h1>
<p>Paragraph text</p>
<p>
<img src="http://www.comfsm.fm/~dleeling/marlin.jpg">
</p>
<p>
<a href="http://www.comfsm.fm/~dleeling/marlin.jpg">
Link to image</a>
</p>
</body>
</html>
Do colors have meanings? Try taking the Global Color Survey. Over 200,000 people have been surveyed. Based on that survey the following meanings tend to be associated with the color that follows.
Happy - Yellow
Good Luck - Green
Good-tasting - Red (tomato)
Dignity - Dark Blue
High Technology - Silver
Sexiness - Red (tomato)
Mourning - Black
Expensive - Gold
Inexpensive - Brown
Powerful - Red (tomato)
Dependable - Blue
High Quality - Gold
Nausea - Muted Yellow
Deity - White
Bad Luck - Black
Favorite Color - Blue
Least Favorite Color - Dark Yellow
angle x11color
Black
DimGray
Gray
DarkGray
Silver
LightGrey
Gainsboro
WhiteSmoke
White
00 RosyBrown
00 IndianRed
00 Brown
00 FireBrick
00 LightCoral
00 Maroon
00 DarkRed
00 Red
00 Snow
06 Salmon
06 MistyRose
09 Tomato
15 DarkSalmon
16 OrangeRed
16 Coral
17 LightSalmon
19 Sienna
25 Seashell
25 Chocolate
25 SaddleBrown
28 SandyBrown
28 PeachPuff
30 Peru
30 Linen
33 DarkOrange
33 Bisque
34 BurlyWood
34 Tan
34 AntiqueWhite
36 NavajoWhite
36 BlanchedAlmond
37 PapayaWhip
39 Orange
38 Moccasin
39 Wheat
39 OldLace
40 FloralWhite
43 Goldenrod
43 DarkGoldenrod
48 Cornsilk
51 Gold
55 PaleGoldenrod
54 Khaki
54 LemonChiffon
56 DarkKhaki
60 Beige
60 LightGoldenrodYellow
60 Olive
60 Yellow
60 LightYellow
60 Ivory
80 OliveDrab
80 YellowGreen
82 DarkOliveGreen
84 GreenYellow
90 LawnGreen
90 Chartreuse
120 DarkSeaGreen
120 ForestGreen
120 LimeGreen
120 LightGreen
120 PaleGreen
120 DarkGreen
120 Green
120 Lime
120 Honeydew
147 MediumSeaGreen
146 SeaGreen
150 SpringGreen
150 MintCream
157 MediumSpringGreen
160 MediumAquamarine
160 Aquamarine
174 Turquoise
177 LightSeaGreen
178 MediumTurquoise
180 DarkSlateGray
180 PaleTurquoise
180 Teal
180 DarkCyan
181 DarkTurquoise
180 Aqua
180 Cyan
180 LightCyan
180 Azure
182 CadetBlue
187 PowderBlue
195 LightBlue
195 DeepSkyBlue
197 SkyBlue
203 LightSkyBlue
207 SteelBlue
208 AliceBlue
210 DodgerBlue
210 SlateGray
210 LightSlateGray
214 LightSteelBlue
219 CornflowerBlue
225 RoyalBlue
240 MidnightBlue
240 Lavender
240 Navy
240 DarkBlue
240 MediumBlue
240 Blue
240 GhostWhite
248 DarkSlateBlue
248 SlateBlue
249 MediumSlateBlue
260 MediumPurple
271 BlueViolet
275 Indigo
280 DarkOrchid
282 DarkViolet
288 MediumOrchid
300 Thistle
300 Plum
300 Violet
300 Purple
300 DarkMagenta
300 Magenta
300 Fuchsia
302 Orchid
322 MediumVioletRed
328 DeepPink
330 HotPink
340 PaleVioletRed
340 LavenderBlush
348 Crimson
350 Pink
351 LightPink
Refraction: the bending of light when a light beam passes at an angle to a surface between two optically transparent materials of differing densities.
Monday demonstration included a laser, prisms, and half-round dishes with water to show bending of light. Alternately, a video on optics, reflection, refraction, and total internal reflection can be shown.
Wednesday moves on to introduce convex and concave lenses. Use magnifying lens to produce an image. Introduce object distance and image distance. If sunny, use the pinhole and paper punch hole camera to demonstrate pin hole cameras and effect of aperture size on clarity. Move on to explain human eye, iris and pupil. Move on to cover myopia, hyperopia, presbyopia, and remedies.
Another demonstration that fits here is the coin under the glass of water.
If a video was shown on Monday, use Wednesday to demonstrate reflection, refraction, and total internal reflection. Provide definitions. On a sunny Friday with a long enough, flat enough stretch of straight road, an inferior mirage might be visible and then explained.
Light bending
Before breaking into groups and making measurements, ask the students to predict the relationship for the mirror. Label any theories by the last name of the student who first proposes the theory, "_________'s theory of reflection."
A focus on education: Note that while science tends to explore questions, these questions can be rewritten as student learning outcomes. Students will be able to determine the nature of the relationship between the object distance and image distance for a plane mirror. If the relationship is linear, students will be able to determine the slope and intercept for the relationship. Students will be able to determine the nature of the relationship between the object depth and image depth for am object underwater. Students will be able to calculate the index of refraction for water based on the slope of the relationship between the object depth and image depth for an object underwater.
The word "image" is related to the word "imaginary." The image of the object is "not really there."
Place an object in front of the mirror. Measure the apparent distance x₁ of the image of object "behind" the mirror. Measure the distance y₁ from the object to the mirror. Record the distances in centimeters. Note that to obtain a constant known as the index of refraction for water, the image distances will have to be placed on the x-axis and the object distances will have to be placed on the y-axis. This puts the independent variable on the y-axis and the dependent variable on the x-axis. For consistency, both of the two parts will record image distances as x₁ and object distances as y₁.
| x₁ | y₁ |
|---|---|
Where:
x1 is the image distance in centimeters
y1 is the actual object distance in centimeters.
A note on variables: the letter "i" is used for the square root of one and current. The letter "o" is simply confusing.
When an object is underwater, the object appears closer. The actual depth of the object is called the object depth y₂ in this laboratory. Measure all distances from the top surface of the water. The object, especially when viewed from an angle above the water, will appear to be shallower that the actual depth y₂. This is an image of the object caused by refraction. Technically refraction is due to bending of the light as the light rays leave the water and enter the air. The apparent depth of the object under the water is the image depth x₂. To accurately determine the image depth you may have to move your head left and right above the object.
Measure the object depth y₂ and the image depth x₂ for the object under the water. Start with an empty tub, recording both the object depth y₂ and the image depth x₂. Add water and repeat the measurements. Continue until the tub is full. Record the distances in centimeters.
An alternate procedure is to use multiple beakers and graduated cylinders each with a different amount of water. This procedure has an advantage when the laboratory is done in locations where the water may go off during the day. Large graduated cylinders on the order of 50 cm tall tend to produce more accurate results.
Be careful to measure the actual and apparent depth below the surface of the water, not the top of the container.
Make measurements at many different depths. Run an mathematical analysis on the results, producing the appropriate graphs and mathematical relations.
| x₂ | y₂ |
|---|---|
Where:
x₂ is the image distance in centimeters
y₂is the object distance in centimeters.
Desmos is able to chart two data tables onto a single graph. If using spreadsheets to perform the analysis, then two charts are likely to be necessary.
Reflection analysis: If using Desmos and the data appears to be linear, determine the relationship between the image distance x₁ and the object distance y₁ using the relationship y₁~mx₁.
Refraction analysis: If using Desmos and the data appears to be linear, determine the relationship between the image distance x₂ and the object distance y₂ using the relationship y₂~nx₂.
For the apparent depth data, refraction theory suggests that the slope of the line should be equal to the index of refraction for water n. Look up the published index of refraction for water. Report this value and cite your source using either APA or MLA format. Run an error analysis to determine the percentage difference between the experimental index of refraction for water (the slope of the line on the second graph) and the published index of refraction.
Discuss the findings. Is there a mathematical relationship? Is the relationship linear or non-linear? Report a conclusion as to the relationship between the object distance and image distance for reflection in a flat mirror. If there are one or more mirror theories, discuss which one might be correct and why. Discuss the accuracy of your results for part two, the index of refraction for water. Discuss also any difficulties you encountered.
The lab will also be marked on grammar, vocabulary, organization, and cohesion.
Instructional note: Post-lab next day wrap-up could include refractive index of water and implication for divers working underwater. Relative distance and magnification. Alternatively, inferior mirages can be demonstrated if the conditions on campus, both physically and in terms of weather, permit the observation of mirages.
If one thinks of standing under a waterfall, there are two factors that contribute to the force of the water. The first is how far the water falls - how high is the waterfall. The second is how much water is falling - the amount of water. The higher the waterfall, the greater the force on a person standing underneath. The greater the amount of water, the greater the force on a person standing underneath. The height of a waterfall is called "the head" and the amount of water flowing is called the "current." Similarly, electricity flowing in a circuit is characterized by two factors: voltage and current. Similar to head, the voltage is a measure of the electromotive "pressure" in the circuit. The amount of electricity flowing is called the "current." These are just "analogies" and they are not exactly comparable, but the factors for a stream can help you think about electricity.
Voltage: The voltage is the amount of electrical "pressure" in a circuit. Voltage is measured in volts using a voltmeter. The letter for voltage is a capital letter V. This can be confusing because the variable for Voltage is capital letter V and the units for voltage is also a capital letter V.
Current: The current is the amount of electricity flowing in a circuit per unit time. Current is measured in amperes (amps) using an ammeter. The letter for current is the lower case letter i.
Power: Power is the amount of electrical energy consumed per second. Power can be calculated from the relationship P = iV where P is the power in Watts, i is the current in amperes, and V is the voltage in Volts.
Resistance: The resistance refers to the resistance to the flow of electricity in a circuit. Resistance is defined by the drop in voltage as a current flows through a load. A load can be a light bulb or any other electrical appliance. Loads include coffee pots, fans, rice cookers, ovens, refrigerators, cell phone speakers, microwave ovens, televisions - anything powered by electricity. The letter for resistance is a capital letter R. Resistance is calculated by using Ohms law: V = iR. The units for resistance, technically volts per ampere, are called Ohms and use a capital Greek letter omega: Ω
The symbol for resistance in a circuit diagram is a repeated "w" shape.
A coffee maker uses 900 Watts according to the plate on the bottom of the coffee maker. The coffee maker is a standard 120 volt appliance. Wall outlets supply 110 to 120 volts. Using Ohms law and the power relationship above we can calculate the resistance and the current. To calculate the resistance we would need the current. The power relationship above can give us the current. P = iV or i = P ÷ V. 900 ÷ 120 = 7.5 amps. Using the current i = 7.5 amps, the resistance R = V ÷ i = 120/7.5 = 16 Ω
A wall outlet is typically designed to handle no more than 18 amps. One can add the amperages for appliances and if the total exceeds 18 amps, the circuit is overloaded and can overheat. In theory a circuit breaker should trip (open and disconnect the circuit) if the amperage exceeds 20 amps on a single phase household circuit. If the breaker does not trip, then there is a risk of fire.
Cash power is used across Micronesia. The units on the cash power meter are kilowatt hours: one hour of 1000 Watts of power. Or two hours of 500 Watts. Or ten hours of 100 Watts. Power is money. What uses the most power in a house?
Magnets are materials that attract certain materials. Materials attracted by a magnet are referred to as magnetic. Many compounds that contain iron are magnetic. Magnets can be made of iron compounds or more exotic mixtures such as aluminum, nickel, and cobalt as in alnico magnets. Magnets are typically made of metallic compounds.
Magnets produce a magnetic field.
Observe a magnet and iron filings. Sketch the field lines.
Magnets always attract magnetic materials. Magnets, however, can attract or repel other magnets.
This leads to the model that magnets have two "ends." The planet earth also has a magnetic field. When allowed to move freely, magnets align themselves with the field. The end of the magnet that points north is called the north pole of the magnet.
Poles that are the same repel each other. "Likes repel."
Poles that are different attract each other. "Opposites attract."
Demonstrate a Faraday coil with a magnet, a coil, and a microammeter, if available.
What is a closed, open, and short circuit? What materials conduct electricity? How does electrical conduction relate to heat conduction? Is there a linear relationship between the current and voltage for an electrical circuit?
Due to equipment limitations, the following parts do not have to be done in any particular order.
Electrical conductor: An electrical conductor allows electricity to flow through the material.
Electrical insulator: An electrical insulator does not allow electricity to flow through the material.
Cell: A single "battery" is call a "cell." Two or more cells connected together are called a "battery." Each "dry" cell produces 1.5 volts. The symbol for a cell in an electrical diagram is:
In part III of today's laboratory the resistance will be obtained from the slope of a current versus voltage graph.
Schematic diagram: A schematic diagram is a symbolic representation of a circuit using abstract symbols for the power source and loads.
Closed circuit: A closed circuit is one in which electricity flows. In a circuit with a light bulb, the circuit is a closed when the light bulb lights.
Short circuit: A short circuit is one in which electricity flows but not through a load. In a circuit with a light bulb, the circuit is a short circuit when the wire gets hot and the bulb does not light. The current is flowing from the cell directly back into the cell without passing through the load.
Open circuit: An open circuit is one in which electricity does not flow. In a circuit with a light bulb, the circuit is open when the light bulb does not light and the wire does not get hot. No current flows in an open circuit.
Using only a single 1.5 volt cell, a single wire, and a flashlight bulb, make the bulb light up. The materials are on the north table.
In electrical physics a closed circuit is one in which electric current flows. When the bulb lights, the circuit is a closed circuit. The circuit may also be a closed circuit without lighting the bulb. When this happens the wire will get hot. If the wire gets hot, then you have created a short circuit.
A circuit in which no electricity flows is an open circuit. In an open circuit the bulb does not light and the wire stays cool. Draw [i] three sketches. Draw a sketch of a closed circuit that lights the bulb. Draw a sketch of a short circuit. Draw a sketch of an open circuit. Sketch what you actually see with your eyes, drawing the battery, bulb, and wire. Do not use images from the Internet. Turn in your sketch.
Using the two-cell battery and the bulb, test the materials provided on the middle table for conductivity. Note whether the brightness of the bulb varies for any of the materials. Make a table that indicates whether the material is a conductor or a non-conductor of electricity. If laboratory six determined heat conductivity, then include in the same table whether that material was a conductor of heat or a non-conductor of heat in laboratory six. Turn in the table.
Ohm's law indicates that the voltage V is equal to the current i times the resistance R for a circuit. Three circuits are provided. All three circuits include a two-cell battery, a switch to open and close the circuit, a voltmeter that measures the voltage, and an ammeter that measures the current in amperes. The only difference in the three circuits is the number of resistances. Each bulb is a resistance. Each bulb is wired in series, so the resistances add directly. The circuits with one and two bulbs are shown in the schematic diagrams below.
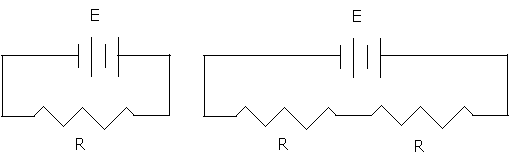
Using the ammeter, measure the current i in amperes. Using the voltmeter, measure the voltage V in volts. Note how the meters are connected to the circuit. The electricity in the circuit flows through the ammeter. The ammeter is measuring a rate of flow of electricity. The voltmeter is arranged "across" a single light bulb. The voltmeter is measuring an electrical "pressure difference" across a single light bulb.
For each of the three circuits measure the current i and the voltage V and record the data in a table [d] [t]. Include in your table the value of the voltage and current when the circuit is "open" (the switch is not closed).
Note also the brightness of the bulb for each set-up and whether the bulb is hot, warm, or cool.
As you record the current and voltage for each of the three set-ups, calculate the resistance for each by dividing the voltage by the current. Does the resistance have a relationship with the brightness and how hot the bulb is?
Make an xy scattergraph of the data in part three. Use the current i as the x variable and the voltage V as the y variable.
Turn in the table from part II, and the graph from part III.
Elements are materials that consist only of atoms with the same atomic number. The atomic number for an atom is the number of positively charged protons in an atom.
The number of electrons is equal to the number of protons. Electrons orbit the protons. This is an oversimplification of reality, but the reality is that the electron is actually a probability wave function. The mathematics to get the electron right are beyond most people on the planet. Best to think of the electron as zipping around the proton. The drawing below left is an abstract image of a hydrogen atom with its single proton and single electron.
The atomic number is determined by the number of protons. Hydrogen has an atomic number of one. The atomic mass is determined by the number of protons and neutrons. While hydrogen always has one proton in the nucleus, the number of neutrons can vary from none to two. Hydrogen with one neutron is called deuterium and has an atomic of mass of two, hydrogen with two neutrons is called tritium and has an atomic mass of three.
Electrons not only go around the proton, but electrons also spin around their own center. Some spin "clockwise" and some spin "counter-clockwise." Spinning is one of the fundamental movements of the universe. Electrons tend to pair up. Electrons are particles, not thinking beings. If electrons could think, we would say electrons like to be in pairs, one spinning one way and the other spinning the other way. Hence, to continue to anthropomorphize, a single electron is lonely and wants an opposite spin partner. The result is that hydrogen's electron will either try to snatch a partner electron from another element or simply run away to an element in which it can become a pair. Two hydrogen atoms will remain bonded together, sharing their electrons, as this puts two electrons together.
Helium is atomic number two because of the two protons in the nucleus. Along with two protons are two neutrons, thus the atomic mass is four.
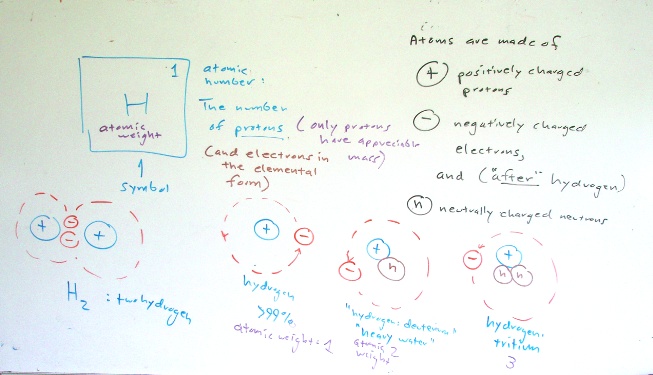
Chemistry from the flower garden into the kitchen
What floral pigments make the best detectors of acids and bases? What substances are acids, bases, or neutral?
This laboratory explores whether flower petal pigment solutions are good indicators of acids and bases. The flower petal pigment solutions are produced by boiling flower petals in water. If a flower petal solution is found that is a good detector of both acids and bases, then that solution will be used to determine whether unknown substances are an acid, a base, or neutral. Flower pigment solutions are also called floral pigments in this laboratory.
In the English language acids are said to be sour or tart. Bases are often said to be bitter.
Demonstrate litmus paper and its reaction to the known acid and base. Note that litmus paper is not always available. In lieu of litmus paper paper, one can produce litmus solutions.
There are three phases to this laboratory.
Collect the flowers and leaves, boil them.
Test each floral solution for color changes, including changing to clear or clear changing to a color. The test involves adding a known acid to the floral litmus solution. Key limes are often used because they are locally available. For a known base fresh baking soda is used. Perhaps a better alternative might be ammonia as baking soda sometimes does not produce as strong a color change as ammonia. The baking soda must be fresh.
Make a data table of your results for the flower that produced a color change for both the known acid and the known base. Specifically record the color change, if any, caused by the known acid or the known base. The table should include:
Look for a change in color as in a change in hue, of color angle, not a change in saturation or luminosity. Watch for the direction of the color change on hue angle color wheel. There is usually a consistency in the direction of the color change. Acids tend to move in one direction around the hue angle color wheel, bases tend to move in the other direction. Which tends to change the color clockwise? Which counter-clockwise? To review the color wheel, refer to laboratory ten.
| Flower or leaf name | Original color (neutral) | color change for an acid | color change for a base |
|---|---|---|---|
Note that you are not testing to determine whether the floral litmus solution is acidic or basic. The floral solution is being used as an indicator fluid. Whether the fluid itself is acidic or basic is not determined by this laboratory, but in general the floral litmus solutions are near neutral.
Use flower petal solutions that change color in a consistent way for acids or bases. If you find one that changes color for both acids and bases, use that one. If you find that one changes colors for acids and another changes color for bases, use both of those two floral pigment solutions. These floral solutions can also be called "litmus" solutions.
Use the floral litmus solution to analyze whether the following household substances are acids or bases (different compounds might be made available on lab day):
Make a table [at] of your results for the household substances noting the color change and whether the substance is an acid, a base, or neutral. Only put the substances present in the laboratory on the day of the laboratory. Not all substances will be available.
[c] Conclusion. Discuss the patterns in the general color changes for acids and bases. Discuss whether the "distance" around the circle might correlate to the strength of the substance. The discussion can also look at whether patterns tend to exist. Are household cleaning substances (soaps, detergents, surface cleaning agents) usually basic or acidic? Are any neutral?
Laboratory fourteen is a term end exploration of a physical system with an underlying mathematical model. The laboratory functions as a term end practical in that the students must decide how to put together an appropriate full length report complete with an introduction, equipment list, procedure, data tables, graphs, analysis, discussion, and conclusions. One of the intents is to see what the students can do when given only minimal guidance and little in the way of formal framework.
The lab chosen varies from term to term and has included exploring the index of refraction of glass, the subsequent bounce heights of a ball, and an exploration of frisbee velocity versus distance. Another intent of the laboratory is to focus again on the nature of possible mathematical models that a system can exhibit. The laboratory chosen should lead to a better understanding of questions such as those that follow.
The graph plots three data sets for three different possible mathematical models. One data set is plotted as squares, one as circles, and a third as triangles.
The distance that an object thrown parallel to the ground at a height h above the ground is given by the equation:
Where d is the distance the object will travel, h is the height, g is the acceleration of gravity, and vhorizontal is the speed with which the object is thrown. In this situation the launch angle relative to the ground is 0°. The object only travels horizontally for the duration of the fall time. A graph of velocity versus distance will be linear of the form y = mx where the slope m will be the square root constant in the equation above. For a horizontal throw one meter above the ground the slope will be 0.45 seconds. This equation holds for objects that fall when thrown horizontally such as balls. Throw the object with twice the velocity, the object will go twice as far.
Objects that fly such as flying disks and flying rings should travel farther and outperform a non-flying object. This laboratory seeks to explore whether flying disks and rings outperform non-flying objects and to determine the nature of the mathematical relationship between velocity and distance.
Gather velocity versus distance data. Use distance the disk flies divided by the time of flight to calculate the velocity. Note that this velocity is technically a mean velocity as the speed of the disk decreases during the flight. Launch velocities, however, are difficult to measure. Use the data gathered to determine the mathematical relationship between velocity and distance. Equipment will include flying disks, flying rings, timing devices, and distance measuring capability. Stopwatches, GPS units useful. Radar guns worth trying for launch velocity.
Bring three balls!
What is site swap notation?
 Early in the course a quote from Freeman Dyson was used to start a journey through the mathematical models (relationships) that explain physical systems. Dyson calculated how an electron ought to behave. Later someone went into a laboratory and the electron behaved as predicted by the mathematical model. In laboratory two a linear model predicted the location of a rolling ball. In laboratory three a falling ball obeyed a quadratic mathematical relationship. The behavior of a marble rolling off of a banana leaf obeyed a square root relationship. And in laboratory four the marbles knew what to do in order to mathematically conserve momentum. Sound, the relative depth of an image, and Ohm's law all exhibited linear relationships.
| Language | Juggle! |
|---|---|
| Marshallese | ejōjō |
| Kosraean | kahkah furoh |
| Pingalapese | mwandimwanda |
| Mwoakillese | medapwedah |
| Pohnpeian | dapadap |
| Mortlockese | |
| Northern Noumeneas | sippo* |
| Southern Noumeneas | |
| Faichuukese | |
| Satawalese (Yap) | |
| Woleaien | |
| Ulithian | |
| Yapese | machyoch |
| *Technically a child's game in which a ball is tossed up and rocks are grabbed in the hand and then the tossed ball is caught | |
There are other mathematical relationships that govern physical systems. There are systems that are modeled by exponential, logarithmic, and circular functions. There are exotic functions such as the hyperbolic sine and hyperbolic cosine. Some systems are best described by complex variables that include a real and an imaginary component. Many of these systems are beyond the mathematical scope of this course.
The relationships above are algebraic mathematical models. Much of the mathematics curriculum is centered on algebra in part because algebra is important to describing the physical world. There are, however, other mathematical models, non-algebraic models. This laboratory seeks to broaden your mathematical horizons by introducing a mathematical model and notation that is not algebraic. In this laboratory you will learn about the mathematics of site swaps.
Juggling is the art of keeping more bodies in the air than the number of hands used to loft the bodies. Juggling is an old tradition in Micronesia. Juggling balls follow a parabola in the air. The vertex will be an important concept in this laboratory.
Site swap mathematics provides a mathematical notation for juggling that describes the possible juggling patterns for a given number of balls. The numbers are an abstract short hand. The numbers do not tell you how to juggle, the numbers do not tell you where to move your hands, nor whether to throw balls over or under other balls. Site swap notation only tells you to what hand (landing site) the ball will next go.
A simple three ball cascade juggle has each of the three balls passing through each of the hands in alternation. Each hand must touch each ball in succession, with the balls being passed from the right (R) to the left (L) hand and back to the right. The first ball thrown must "fill" the right hand after the third ball has left the right hand. Every ball in this pattern lands three hands (sites) after being thrown.
In the above space-time diagram time is passing as one moves from left to right. R is the right hand, L is the left hand. The hands are the landing "sites," numbered S0, S1, S2… The three balls are indicated by the circles, with the balls numbered from one to three. Note that the first ball thrown lands on the third available landing site S3. S3 is a left hand landing site. Ball one is then launched by the third hand and lands three sites later at S6, a right hand landing site.
The landing site Sn can always be calculated by adding a three to n.
If we "interleave" the left hands in between the right hands
...we obtain the following diagram:
Studying the above diagram we can see that the number one ball moves three "hands" down the sequence before landing on the left hand (think of hands as landing sites, hence the use of the word site in the name of the notation). The first ball returns to the right hand after moving three more hands (or sites) rightward in the diagram. Remember, the other balls are following the same pattern, landing three sites down.
The pattern above is called a three-ball cascade. In the cascade pattern above each ball lands on the third open site after being thrown. Mathematically this is recorded as 3 3 3 3 3 3 3 3 3... This means each ball lands on the third site down the diagram. To save space, we toss the spaces and write 33333... For further simplicity we invoke a rule that number patterns repeat indefinitely, hence a single 3 can be used to denote this pattern. Thus 3 means 3333333.... forever.
There are four basic patterns in juggling.
Another pattern is the three ball shower, with the balls always being thrown from one hand and then caught and fed back to the first hand in a transfer. The right hand must "launch" the balls in sequence "downrange" to the opposite hand. The first opposite open "site" (hand) that permits a transfer (a throw of 1) to set up the relaunch of ball one is the fifth site.
Mapping the launches and landings of the other two balls confirms that the balls land "5 site" downrange. This is referred to as a 5 1, or 51 with the spaces removed, with each ball executing the same 51 pattern over and over: 515151...
Other notes:
The notation is called site swap in part because one can "swap" or "switch around" the "sites" (hands!) on which balls land. That it, from a three ball cascade one can toss a ball from the right hand straight up, catching the ball four sites (or four counts or four beats) later. This gives one time to catch and throw a ball from the left hand while the 4 count ball is airborne. While this is happening the left hand holds onto a ball. This is counted as a "2" in the world site swaps (even numbers return to the same hand, holding a ball for an extra beat results in calling this a count of 2).
The diagram depicts a start of a three ball cascade with a single column ball off the right hand followed by a return to a three ball cascade. The notation, unsimplified, would be 33423333...

Site swap notation is a mathematical model for juggling, another physical system. Juggling ball orbits are predictable and juggling machines have been successfully build without the need for microprocessors or computers. This single variable mathematical system has rules and systems of proof. The intent of this laboratory is expand your thinking, to get you to consider any system that you see as potentially having a mathematical model underneath the system.
To determine the number of balls calculate the average for each sequence. Add the numbers as single digits and then divide by the number of numbers. [Note to real site swappers: this is intended as math exercise and the author does not mean to imply that this condition is by any means sufficient. It is not sufficient. The class will not be checking for multiplex landings, transition issues, or excited states.]
If the mean is fractional, then the pattern does not exist or is incomplete.
In the world of site swap notation "equations" would look like 33342333. The equation can be true or false. 33342333 is a true equation because (3+3+3+4+2+3+3+3)/8 = 24/8 = 3. The result is a whole number. The result is the number of balls.
Thus site swap mathematics has equations, the equations make predictions about a physical system.
Running and juggling is difficult with anything other than patterns that synchronize with the cadence of the runner. Asymmetrical patterns such as 51 are very difficult to maintain while running. Since cadence is essentially a two beat, left right proposition, this author suspects that only patterns of single digits N M where N = M are really functional. This is potentially a massive limitation leaving only simple cascades as a functional possibility.
Science is best learning by doing. In order to "do" site swap equations, you have to learn to juggle. Thus we will tackle learning to perform a simple cascade.
Three balls roughly tennis ball size - bring your own!
For more information and further reading see the following pages:
Siteswap FAQ by Allen Knutson
Siteswap from Wikipedia
The science of juggling