I apologize up front for what will be a lengthy explanation. I also apologize as this note builds on earlier notes.
That note generated questions about my proposed mechanism for gathering student learning outcome measurement data. The upshot is that I had proposed chairs and instructional coordinators would sit down with faculty in a program, like a focus group, and look at the course level student learning outcomes pertinent to a particular program student learning outcome. The discussion would result in a cross-grid of information that might appear as follows:
| Students will be able to: | analyze: 2005 | foundations: 2006 | human body: 2008 | problem solve: 2009 |
| Define the concept of total fitness and the essential characteristic and consideration of a physical fitness program. | Students have a good understanding of the concept based on tests and in class discussions, according to the instructor. Yet few exhibit behaviors that show they actually value fitness. | |||
| Describe the process of conception as well as the influence of heredity and environment to the developing human organism. | Students have a good understanding of this concept. | |||
| Describe what it means to be healthy. | The students are able to respond correctly when asked this question. | |||
| Discuss the effect of drugs to the human body, human behavior and its consequence to family and society. | The students are very capable at expressing themselves on these effects, whether orally or in writing. | 1 | ||
| Enumerate the causes and prevention of communicable diseases. | Students are able to enumerate the causes and prevention. | |||
| Explain how the environment can affect health. | The students exhibit a number of misunderstandings and misconceptions concerning this topic. | |||
| Explain the body functions and the relation of each system to one another. | 1 | |||
| Explain the effect of the electrical signals and chemical messengers to human physiology and behavior. | 1 |
The objection is that the proper and correct way to do this is to measure every student against every outcome. One instructor showed me a wonderful grid that was built from such an analysis, twenty students by twenty outcomes, for 400 data points. I do not argue that this is the correct way to "feed" data into the unified assessment plan I have proposed (also variously referred to as the grand unified theory or GUT). This is direct measurement and certainly an optimal way to gather information.
In another note that I sent, I noted that this system does not scale up. In MS 150 statistics each student learning outcome is measured multiple times during the term, a skill is not simply demonstrated and then we move on. The ultimate assessment is the final, which directly measures 41 of the 49 student learning outcomes on the MS 150 Statistics outline. All of the eight not on the final are covered at other points during the term, and some of these eight are variations of the 41 which are tested. With 55 students, the final examination grid is a 2255 data point matrix. This does not include the assessment done during twelve quizzes, midterm, two tests, and nearly daily homework.
Having just taught the course and having personally marked every single paper, I argue that I can now sit down and summarize the achievement and attainment of course level student learning outcomes. I could sit down with a chair and generate information such as that seen in the table above. I could also summarize the strengths and weaknesses of the students. I did this about four hours ago, writing the following:
Prior analysis: Instructor expects lower rates of success for level of measurement, histogram, point estimate for a pop mean, confidence interval conclusion (20), hypothesis test conclusion (28, 29), predictions off the linear regression, why or why not a linear regression might be appropriate (41). Students have difficulty when at analysis and evaluation levels. Strengths would be any basic calculation generated from a single formula: knowledge level material.Although a true and correct analysis would require looking at all quizzes, tests, the midterm, and the final, I opted to item analyze the final examination and see if my intuition was borne out by data. In other words, do I have to do a rigorous student-by-student, outcome-by-outcome analysis to obtain valid data for the course student learning outcomes?
At this point one can stop reading if one likes, I am about to embark on climbing a Pirsig ian mountain of quality assessment, when I am done my expectation is that I will arrive back where I started from above. I argued a similar point in a series of monologues in the fall of 2002, but I did not at that time have an assessment model in mind that I felt was a way forward other than to argue that grades had sufficient meaning if they were the result of qualified faculty implementing courses based on outline built from student learning outcomes. The unified assessment plan is an evolution in my thinking to find ways to get at student learning without burying faculty in aggregating student-by-student, outcome-by-outcome mountains of data.
I went through the final, paper by paper, question by question, noting who got what right in a 2255 grid, a small corner of which is reproduced below:
| q | ap | pt | aln | si | fh | ba | mae | ls |
| 1 | 1 | 1 | 1 | 1 | 0 | 1 | 1 | 1 |
| 2 | 1 | 1 | 1 | 1 | 1 | 1 | 1 | 1 |
| 3 | 1 | 1 | 1 | 1 | 1 | 1 | 1 | 1 |
| 4 | 1 | 1 | 1 | 1 | 1 | 1 | 1 | 1 |
| 5 | 1 | 1 | 1 | 1 | 1 | 1 | 1 | 1 |
| 6 | 1 | 1 | 1 | 1 | 1 | 1 | 1 | 1 |
| 7 | 1 | 1 | 1 | 1 | 1 | 1 | 1 | 1 |
I then calculated the percentage of students who obtained question one correct. Each of the 41 questions on the final maps one-to-one with a specific student learning outcome on the course outline. The table below includes performance on the first seven questions and the student learning outcome being measured:
| q | corr | incorr | 55 | cSLO | cSLOcat | sSLO |
| 1 | 60% | 40% | 33 | 1 | basic stats | Identify different levels of measurement when presented with nominal, ordinal, interval, and ratio data. (define) |
| 2 | 100% | 0% | 55 | 1 | basic stats | Determine a sample size (calculate) |
| 3 | 91% | 9% | 50 | 1 | basic stats | Calculate a sample mean (calculate) |
| 4 | 96% | 4% | 53 | 1 | basic stats | Determine a sample median (calculate) |
| 5 | 96% | 4% | 53 | 1 | basic stats | Determine a sample mode (calculate) |
| 6 | 100% | 0% | 55 | 1 | basic stats | Determine a sample minimum (calculate) |
| 7 | 98% | 2% | 54 | 1 | basic stats | Determine a sample maximum (calculate) |
Earlier I noted an instructor had a 20 by 20 grid. In that instructor's analysis, student performance was rated as high, moderate, and low based on percentages. Although not quite the same underpinning, the above analysis could be converted to a similar rating system.
At this point I can go back and check my intuition:
| q | corr | incorr | 55 | cSLO | cSLOcat | sSLO |
| 29 | 16% | 84% | 9 | 3 | ci hyp | [Determine risk of a type I error] |
| 41 | 27% | 73% | 15 | 5 | linreg | [Explain why a linear regression is appropriate] |
| 34 | 45% | 55% | 25 | 5 | linreg | Solve for a x value given an y value and the slope and intercept of a least squares line. (Solve) |
| 14 | 47% | 53% | 26 | 2 | charts | Identify the shape of a distribution as being symmetrical, uniform, bimodal, skewed right, skewed left, or normally symmetric. (define) |
| 15 | 51% | 49% | 28 | 1 | basic stats | Determine a point estimate for the population mean based on the sample mean (calculate) |
| 27 | 51% | 49% | 28 | 4 | p | Infer from a p-value the largest confidence interval for which a change is not significant. (interpret) |
| 33 | 53% | 47% | 29 | 5 | linreg | Solve for a y value given an x value and the slope and intercept of a least squares line. (Solve) |
| 20 | 53% | 47% | 29 | 3 | ci hyp | Use a confidence interval to determine if the mean of a new sample places the new data within the confidence interval or is statistically significantly different. (interpret) |
| 28 | 55% | 45% | 30 | 3 | ci hyp | [fail to reject or reject hypothesis] |
Bear in mind that I typed my pre-analysis prior to the item analysis, yet I nail the first two (29 and 41) based on my prediction. 28 and 20 are also on the list. #33, while not specifically noted by number, is a prediction off of a linear regression. I had noted this would be low. While I did not guess that 27 would appear, it is an inference and I noted that students have increasing difficulty as they move up Bloom's taxonomy. Although not intuited directly by me prior to the analysis, I argue that this does not represent some fundamental "gem" of not previously intuited knowledge. That question required an inference by the students, and that is tough for the students.
My point is that I did not miss any weak areas in my intuitive analysis. I did not have to do the item analysis or student-by-student outcome-by-outcome analysis to get useful information which I can use to improve learning.
I thought I ought to flow the above analysis up the unified assessment plan hierarchy just to see if I learn anything I do not already know intuitively. The MS 150 Statistics course outline includes course level student learning outcomes (five general objectives) and specific student learning outcomes (49 specific objectives). I cross-tabulated the student answers against the five course level student learning outcomes and obtained the following results:
| n | sumif | countif | total possible | correct | incorrect | cSLOcat | cSLO |
| 1 | 536 | 11 | 605 | 89% | 11% | basic stats | Calculate basic statistics |
| 2 | 135 | 4 | 220 | 61% | 39% | charts | Represent data sets using histograms |
| 3 | 463 | 12 | 660 | 70% | 30% | ci hyp | Solve problems using normal curve and t-statistic distributions including confidence intervals for means and hypothesis testing |
| 4 | 69 | 2 | 110 | 63% | 37% | p | Determine and interpret p-values |
| 5 | 489 | 12 | 660 | 74% | 26% | linreg | Perform a linear regression and make inferences based on the results |
| 1692 | 2255 | 75.03% | 24.97% | 55 students, 41 items: 2255 student-items |
This table reveals an interesting parallel to data I gathered in 2003 and 2004 using an instrument that did not meet with approval from an assessment expert: students have trouble working with charts and graphs.
Overall there were 1692 successfully attained outcomes among the 55 students, out of 2255 total possible successes. 1692/225 is a 75% success rate based on the item analysis of the final examination. Students in MS 150 attained an average of 229 points out of 306 points possible or a course wide average of 75%. Coincidence? No, design. Grades, the distribution of grades, and course averages have meaning if, and only if, qualified faculty are implementing courses based on outlines built from student learning outcomes. Assessable meaning.
I then explored how the above item analysis assessment might flow up through the LA/HCOP program and on up into the institutional student learning outcomes. First I ran the specific learning outcomes against the LA/HCOP program student learning outcomes:
| seq | pslo# | pSLOcat | course | cslo level | attainment | Students will be able to: |
| 230 | 6 | problem solve | MS 150 | course | 89% | Calculate basic statistics |
| 231 | 6 | problem solve | MS 150 | course | 61% | Represent data sets using histograms |
| 232 | 6 | problem solve | MS 150 | course | 70% | Solve problems using normal curve and t-statistic distributions including confidence intervals for means and hypothesis testing |
| 233 | 6 | problem solve | MS 150 | course | 63% | Determine and interpret p-values |
| 234 | 6 | problem solve | MS 150 | course | 74% | Perform a linear regression and make inferences based on the results |
| 235 | 6 | problem solve | MS 150 | specific | 60% | Identify different levels of measurement when presented with nominal, ordinal, interval, and ratio data. (define) |
| 236 | 4 | foundations | MS 150 | specific | 100% | Determine a sample size (calculate) |
| iSeq | iSLO# | iSLOcat | Prgrm | pSLO# | pSLOcat | sumif | countif | attainment | LA/HCOP program student learning outcomes: students will be able to: |
| 76 | 1 | knowledge | HCOP | 1 | human body | 0 | 0 | Describe the structure, function, and basic pathologies of the human body. | |
| 77 | 5 | communication | HCOP | 2 | communicate | 0 | 0 | Communicate health, nutrition, and premedical information in both written and oral formats. | |
| 78 | 1 | knowledge | HCOP | 3 | career | 0 | 0 | Describe health care and allied professions. | |
| 79 | 1 | knowledge | HCOP | 4 | foundations | 8.64 | 9 | 96% | Demonstrate a foundation in basic biology, chemistry, microbiology, anatomy, nutrition, health, and physiology. |
| 80 | 2 | skills | HCOP | 5 | teamwork | 0 | 0 | Work effectively in groups to solve human life sciences and health problems. | |
| 81 | 6 | analysis | HCOP | 6 | problem solve | 21.37 | 38 | 56% | Quantify and analyze human life sciences and health problems using analytical, statistical, and computer methods. |
| 82 | 1 | knowledge | HCOP | 7 | analyze | 4.33 | 7 | 62% | Acquire and synthesize human life science, health, and nutrition information in a critical, scientific, and technologically advanced manner. |
Done "correctly" this table would aggregate all of the attainments from item analyses in all of the courses in the program, the above attainments are only those attained by MS 150. Note that I considered basic statistics skills as "foundational" even though they are not specifically mentioned by the foundations program student learning outcome.
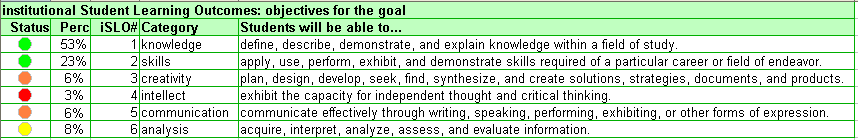
This can be flowed further uphill to the proposed institutional student learning outcomes:
| institutional Student Learning Outcomes: objectives for the goal | |||
| iSLO# | Category | attainment | Students will be able to... |
| 1 | knowledge | 81.02% | define, describe, demonstrate, and explain knowledge within a field of study. |
| 2 | skills | apply, use, perform, exhibit, and demonstrate skills required of a particular career or field of endeavor. | |
| 3 | creativity | plan, design, develop, seek, find, synthesize, and create solutions, strategies, documents, and products. | |
| 4 | intellect | exhibit the capacity for independent thought and critical thinking. | |
| 5 | communication | communicate effectively through writing, speaking, performing, exhibiting, or other forms of expression. | |
| 6 | analysis | 56.23% | acquire, interpret, analyze, assess, and evaluate information. |
| Academic goal | att | |||
| Promote learning and teaching for knowledge, skills, creativity, intellect, and the abilities to analyze new information and communicate effectively. | 69% | |||
At this juncture the percentages have lost any and all meaning - possibly a reductio ad absurdum. The alternative I proposed is more qualitative and more informative. The LA/HCOP contribution to the first iSLO, as proposed in an earlier document is:
| program Student Learning Outcome: students will be able to: | iSLO: analysis | iSLO: communication | iSLO: creativity | iSLO: intellect | iSLO: knowledge | iSLO: skills | |
| HCOP | Demonstrate a foundation in basic biology, chemistry, microbiology, anatomy, nutrition, health, and physiology. | Students are better at basic knowledge calculations and have increasing difficulty as the analysis required moves up Bloom's taxonomy. | Students show solid foundations in these fields, with the exception of nutrition. In general, students tend to be capable of reciting the facts but show evidence they value the information as evidenced by a lack of changes in their behaviors. |
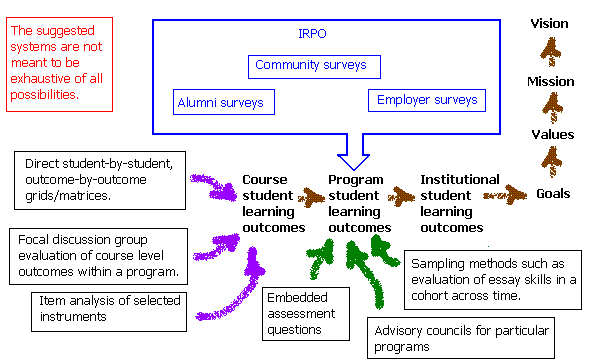
The above is not proposed as the only input to the assessment system. And each assessment should have a "plans for improvement," especially in those areas identified as being areas of weakness. The assessment of program and institutional learning outcomes would also include surveys of the community done by the IRPO office of the alumni, community, and employers. These later three are the program assessment system that Mesa College is using - a system apparently cited as a model in a workshop. I find those three lack the internal "feed" that I have proposed. I see a model something like the following:
Some faculty may choose to do direct student-by-student, outcome-by-outcome analysis. I even did so in my joggling course. Others may sit down with a chair to go over their assessment of student learning. Some may use systems of sampling students and doing outcome-by-outcome analysis of only a sample of students, although this is also then only inferential in its results and risky in small sample sizes. Another approach may be efforts like that of the Languages and Literature division to follow a cohort. I believe that this sort of effort feeds into overall structure at the program level.
I argue that the system allows for many ways for data to flow into the assessment plan, and that shifting to qualitative, descriptive information farther up the plan yields more information that some sort of percentage dashboard (although the below was actually produced from the structure of the plan because, like a protein, the structure of the plan itself has and carries meaning).
Survey instruments of alumni, community, and employers, along with the internally generated data provide a set of inferential data that triangulates on achievement and attainment of student learning.
The unified assessment plan exists as a spreadsheet ( html) that can also be accessed from an assessment web page.
That assessment topics page also has links to other related material.
I hope to share the above model in our workshop slated for late January/early February, but it appears that the workshop will be focused more on specifying benchmarks for indicators such as class size and success rates. I do not get the feeling this is what we need to be doing under recommendation five at this time, but so be it. I foresee a few days of arguing over class sizes and success rates and no progress on an assessment model and system for the college. My apologies if what I am saying steps on toes, but with a March visit evaluating us on progress on recommendation five, I feel real fire under my southern regions to obtain real results at our only system-wide workshop prior to March.
I am also dreadfully fearful that an external expert will at some point dismiss out-of-hand the whole model. I have been really really really hesitant to share this beyond a small group of people here at the national campus. My last effort back in 2003 and 2004 was, as alluded to above, dismissed by a nationally recognized expert in assessment.
I realized, however, that I had to stick my neck out once again when I learned that someone using student-by-student, outcome-by-outcome assessment had not shared their work beyond their unit supervisor. I realized that I was acting out of fear, and letting the fear of attack of my concepts keep me from sharing them, however wrong they might be. Knowing that someone has to climb out of the trenches of fear, and not being aware of any other proposed system for assessing learning, I have offered the above model. If someone has another model or structure, please let me know.
Given the above, I sent this note more broadly than any previous note I've written. Some will not realize that the plan includes a proposed "rewriting" of goal one and adoption of institutional learning outcomes seen above, these were covered in earlier notes to a smaller audience.