MS 150 Statistics spring 2008 test one • Name:
waves
| height/cm |
|---|
| 85 |
| 70 |
| 60 |
| 60 |
| 70 |
| 50 |
| 60 |
| 40 |
| 50 |
| 30 |
| 40 |
| 50 |
| 15 |
| 30 |
| 40 |
| 50 |
On 04 January 2008 the wave heights in centimeters were recorded for translating waves on the reef in Piyuul.

- __________ What is the level of measurement?
- __________ Find the sample size n.
- __________ Find the minimum.
- __________ Find the maximum.
- __________ Find the range.
- __________ Find the mode.
- __________ Find the median.
- __________ Find the sample mean x.
- __________ Find the midrange.
- __________ Find the sample standard deviation sx.
- __________ Find the sample coefficient of variation CV.
- __________ If this data is to be divided into seven bins, what is the width of a single bin?
- Determine the frequency and calculate the relative frequency using seven bins (classes, intervals). Record your results in the table provided.
| Bin upper limits | Frequency F | Relative Frequency |
|---|
| | |
| | |
| | |
| | |
| | |
| | |
| | |
| Sums: | | |
- Sketch a frequency histogram of the data, labeling your horizontal axis and vertical axis as appropriate.
- __________ What is the shape of the histogram?
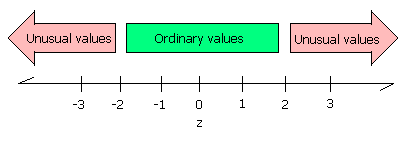
- z = __________ Waves over 80 centimeters that day were producing strong currents and raising the water level on the reef. The small children on the reef could not touch the bottom and had to swim to survive. Use the formula z = (x - x)/sx to find the z-score for a wave that was 80 cm high.
- _________________ Is an 80 cm high wave an ordinary height or an unusual height for waves on the fourth of January based on the sample data above?
Statistics •
Lee Ling •
COMFSM