Using World Health Organization data, Forbes magazine ranked 194 countries from fattest to thinest. The Federated States of Micronesia was number two on the list - the second "fattest" country on the planet Earth behind only Nauru. While there are some issues with the methodology and skeletal muscle impacts on BMI for Pacific Islanders, the nation is facing an epidemic of non-communicable diseases due to life style choices including those resulting from excess body fat. Excess body fat is the intake of more calories per day than one burns per day. The right number of calories to maintain you weight varies as a result of many factors. On average, the recommended daily intake of calories is 1940 for women and 2550 for men. One of the contributors to excess body fat is "fast food." "Fast food" is "fat food." One single double cheeseburger with bacon can be half of your recommended daily calorie intake. Add in the french fries and the soda, and that one meal could take you over your daily recommended calorie intake. Anything else you eat that day will simply become fat in your body. This statistics midterm looks at the calorie content of fast food hamburgers and cheeseburgers from some of the fast food chains in the United States.1
| Company/Product | Calories |
|---|---|
| Burger King Bacon Double Cheeseburger | 510 |
| Burger King Double Beef Whopper | 887 |
| Burger King Double Beef Whopper w/Cheese | 970 |
| Burger King Double Cheeseburger | 478 |
| Burger King Hamburger | 275 |
| Burger King Whopper | 626 |
| Burger King Whopper Jr | 322 |
| Burger King Whopper w/Cheese | 709 |
| McDonald's Big Mac | 570 |
| McDonald's Cheesburger | 318 |
| McDonald's Hamburger | 240 |
| McDonald's McDLT | 680 |
| McDonald's Quarter Pounder | 427 |
| McDonald's Quarter Pounder w/Cheese | 525 |
| Wendy's Double Cheesburger, White Bun | 630 |
| Wendy's Double Hamburger, White Bun | 560 |
| Wendy's Hamburger, Multigrain Bun | 340 |
| Wendy's Hamburger, White Bun | 350 |
| Wendy's Triple Cheeseburger | 1040 |
| White Castle Double Cheeseburger | 285 |
The following section is based on the calorie data in the table.
| Bins (x) | Frequency (f) | Rel. Freq. p(x) |
|---|---|---|
| _______ | _______ | _______ |
| _______ | _______ | _______ |
| _______ | _______ | _______ |
| _______ | _______ | _______ |
| _______ | _______ | _______ |
| Sum: | _______ | _______ |
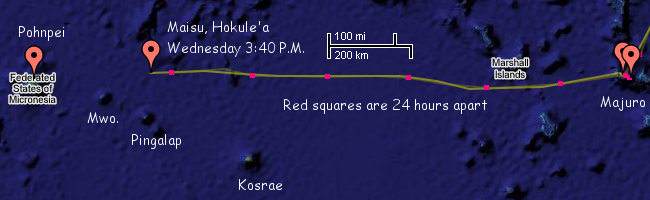
28 February 2007: As this paragraph is being written, the Polynesian Voyaging Society canoes Hokule'a and Maisu are less than 240 kilometers to the east-northeast of Pohnpei. The canoes have sailed from Hawaii. The two canoes left Catalin Channel in the Majuro lagoon ten days ago headed for Pohnpei. The canoes are being navigated using the traditional navigation systems of Satawal as taught by Mau Pialug. The voyage is being called Ku Holo Mau in honor of Mau. The Maisu is a gift of the people of Hawaii to the people of Satawal, Mau's home island, and will remain in Yap. The distance covered by the two canoes varies with wind, current, and weather conditions. The following data is the distance in km from Majuro for the two canoes at three in the afternoon each day Pohnpei time. In other words, the distances are the kilometers covered in a 24 hour time period.
| Day (x) | Distance (y) |
|---|---|
| 1 | 190 |
| 2 | 290 |
| 3 | 369 |
| 4 | 453 |
| 5 | 539 |
| 6 | 648 |
| 7 | 834 |
| 8 | 921 |
| 9 | 1016 |
| 10 | 1147 |
| Statistic or Parameter | Symbol | Equations | OpenOffice |
|---|---|---|---|
| Square root | =SQRT(number) | ||
| Sample mean | x | Σx/n | =AVERAGE(data) |
| Sample standard deviation | sx | =STDEV(data) | |
| Sample Coefficient of Variation | CV | sx/x | =STDEV(data)/AVERAGE(data) |
| Calculate a z value from an x | z | =
|
=STANDARDIZE(x;μ;σ) |
| Find a probability p (the area to the left of x) from an x value | =NORMDIST(x;μ;σ;1) | ||
| Find an x value from a probability p (the area to the left of p) | =NORMSINV(p;μ;σ) | ||
| Slope | b | =SLOPE(y data;x data) | |
| Intercept | a | =INTERCEPT(y data;x data) | |
| Correlation | r | =CORREL(y data;x data) | |
| Coefficient of Determination | r² | =(CORREL(y data;x data))^2 |

1While Micronesians may be "wired to eat", they are not wired to be obese.
2Not all calories are equal. Data for the table from FastFood.com and the Rodale Institute.
3Internationally 25 is used. The appropriate BMI threshold for being overweight varies by the way in which skeletal muscle is distributed, along with deep visceral fat, and bone size. China uses a BMI of 23, the United States 25, and Pacific Islanders should use 27.