
Qalculate! is a powerful numeric and symbolic calculator for Linux desktops. Qalculate! is on the Accessories submenu of the Applications menu.
Above the keypad are two triangular buttons that toggle Qalculate! between keypad and history mode. The history mode provides a fast and easy way to look up a recently made calculation.

Both the keypad and history can be hidden to create a mini-calculator mode. To the right of the data entry window three buttons remain visible.

To make basic calculations, type in the expression and press enter or click on equals.

Expressions are typed in algebraic order. To calculate the square root of a number, click on sqrt first, then enter the number.

Click on the Exact button to display an exact result.
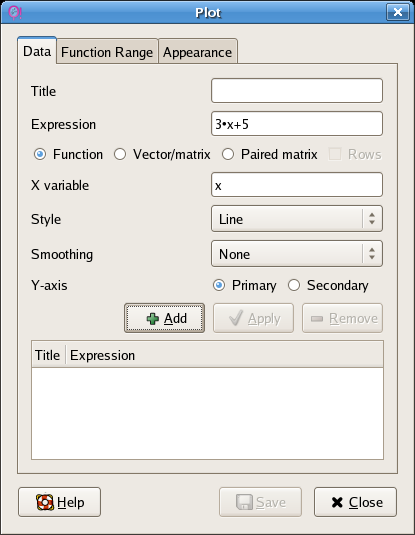
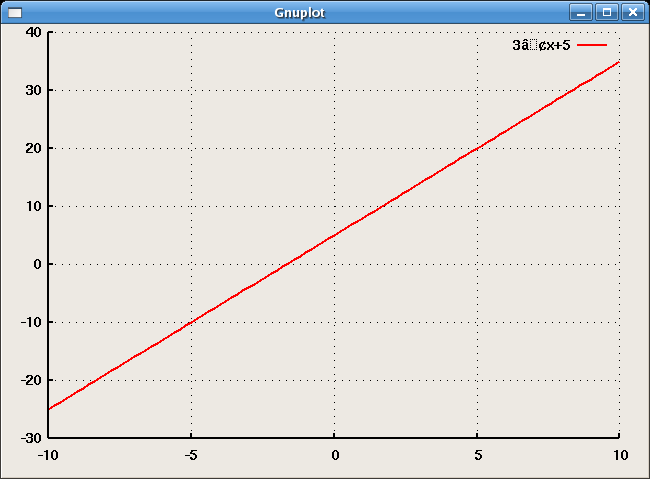
Qalculate! is also a graphing calculator. To graph an expression, simply type in the expression. Use the asterisk * for multiplication including implicit multiplication.

Then click on the "calculate expression" button just to the right of the expression entry window. The "calculate expression" button is the top button in the row of three buttons.

From the File menu choose Plot to open the plot window.
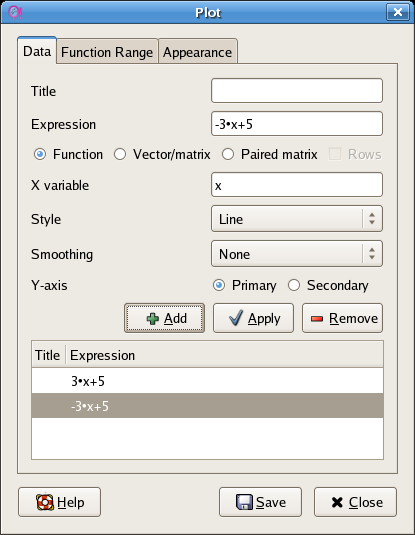
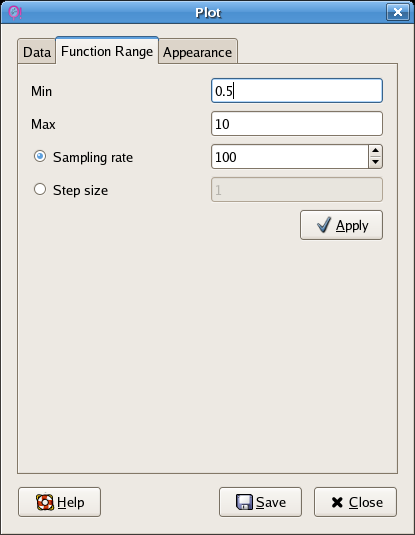
Click on the function range tab to change the domain of the function.
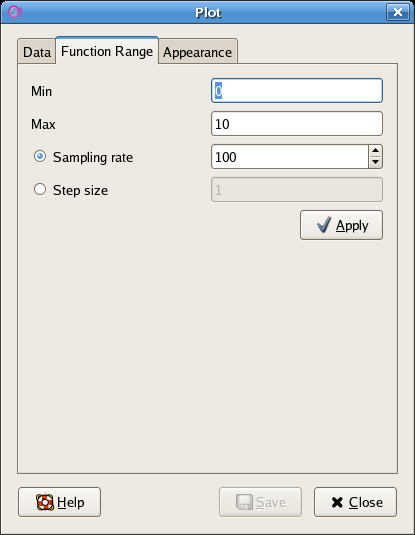
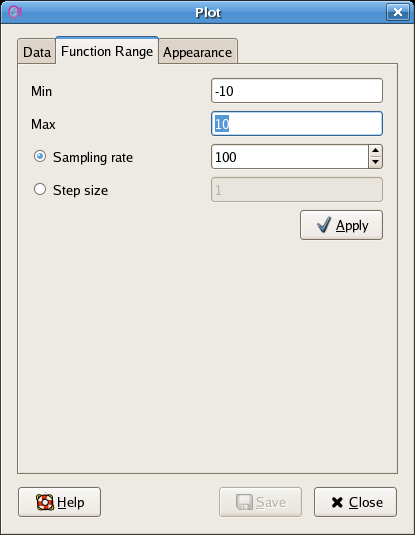
Click on Apply after making changes.
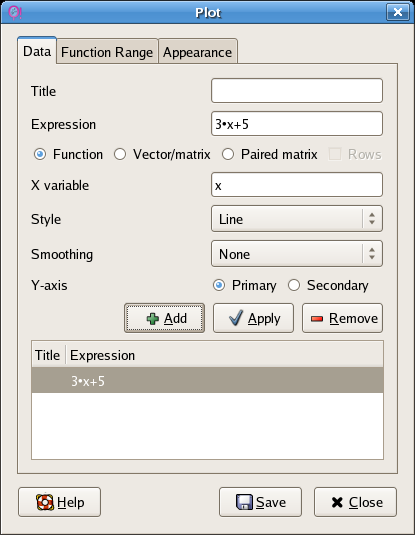
Returning to the Data tab of the plot window, click on Add to add the function to the list of functions to be graphed.
This action will open the Gnuplot window.
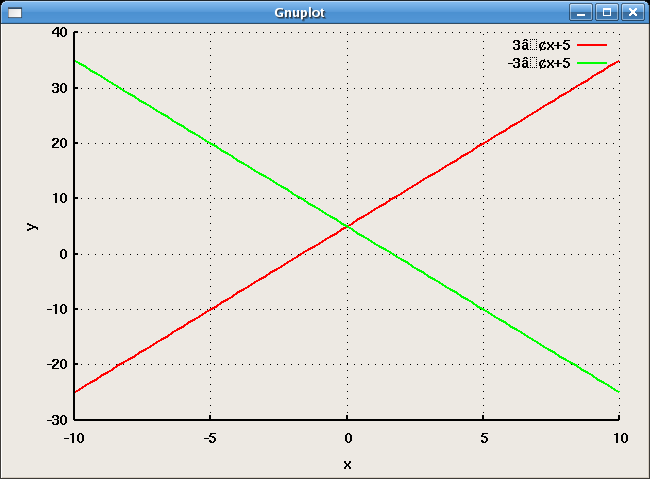
From the plot window, additional functions can be entered and plotted without returning to the Qalculate! main window. Edit the expression in the upper window and then click on Add to add the plot to the Gnuplot window.
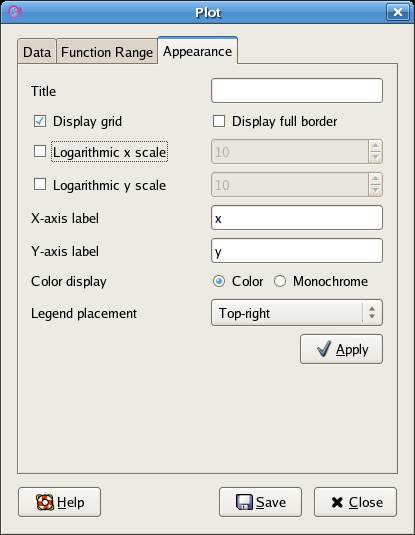
Graph labels can be added from the labels window.
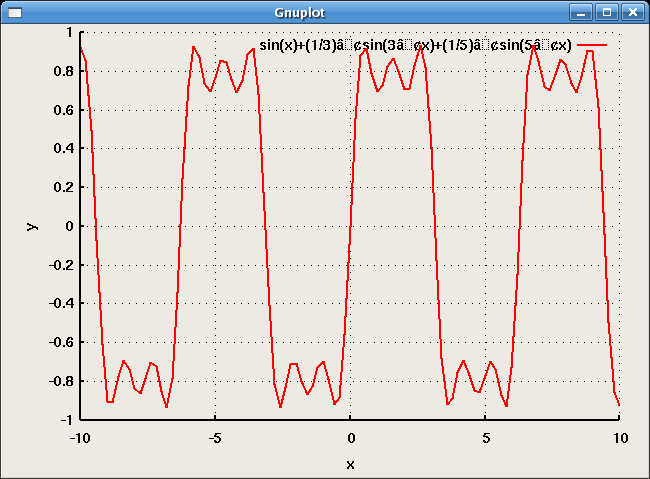
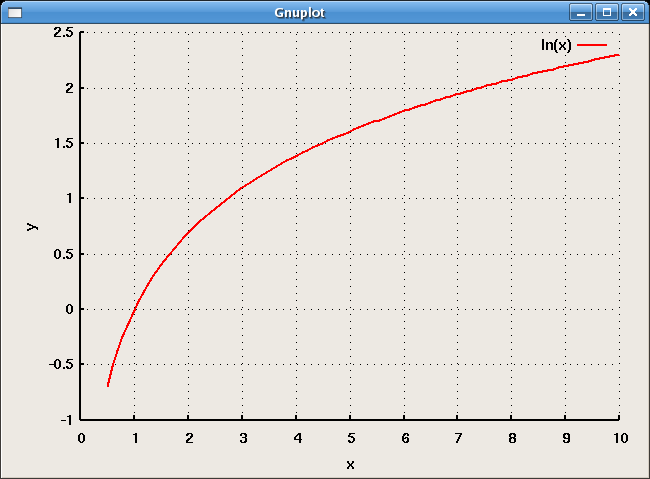
The Gnuplot window now has the following appearance:
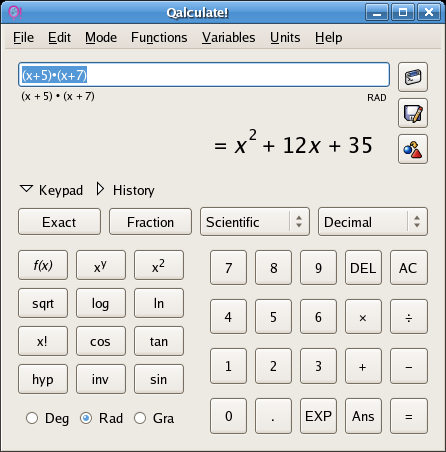
Qalculate! is also a symbolic algebra calculator. The following is a binomial expression expanded using the "Calculate expression" button.
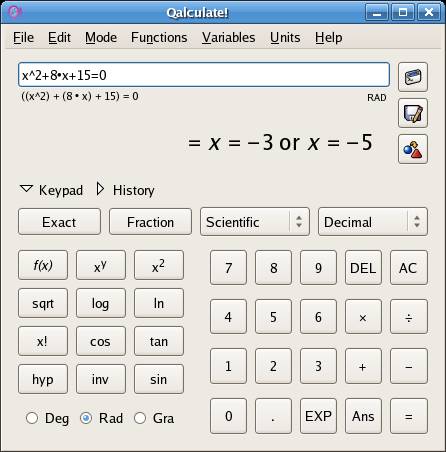
Qalculate! can also solve for an unknown variable in a quadratic equation:
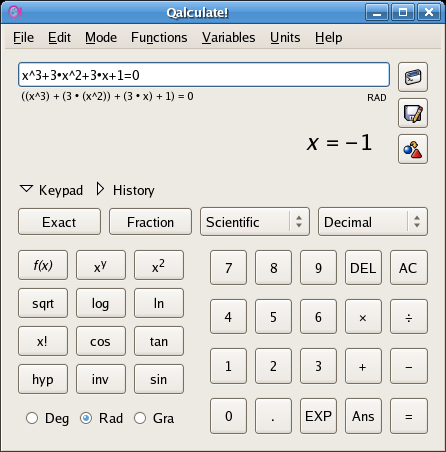
Qalculate! can also solve cubic equations.
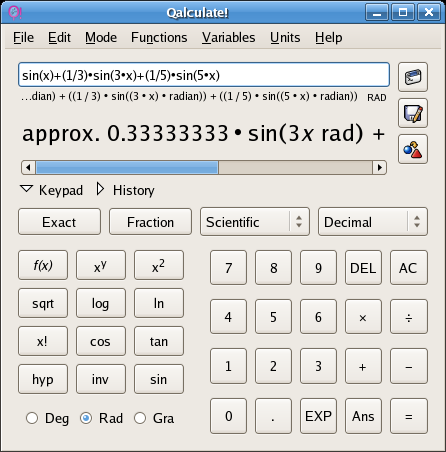
Qalculate! can plot trigonometric expressions. Enter the expression...
...choose Plot from the file menu...
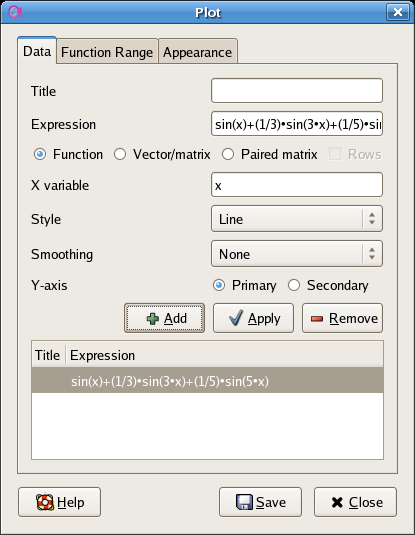
...and Add to the functions window.
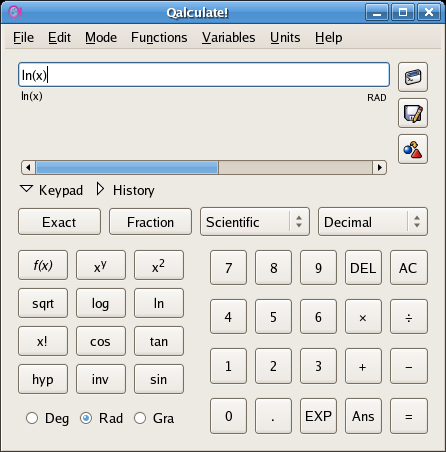
Logarithmic functions are also supported.
If x = 0 is still part of the domain, then a warning dialog will appear.
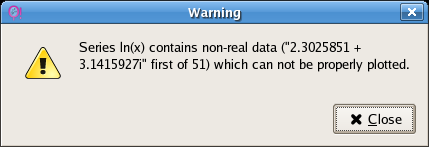
Close the warning window and then use the Plot window to alter the function domain.
The function will now plot without a warning.
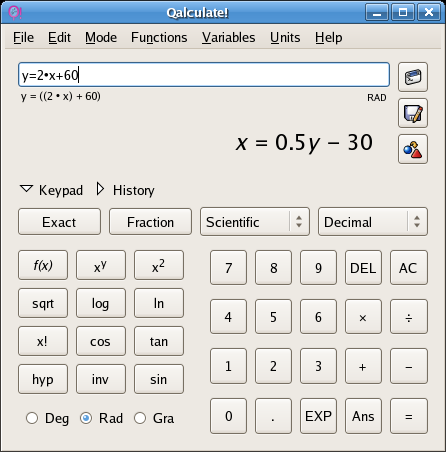
Qalculate! can even invert an equation. Enter the equation and click on the "Calculate expression" button.
A more extension set of help pages is available at: http://qalculate.sourceforge.net/gtk-manual/index.html
When graphing a rational function, control of the range is important to correct rendering of the function. The function below was entered into Qalculate! then the "gears" button in the upper right was clicked (calculate expression).

From the File menu choose plot.

Click the Add button. Note that a dialog box will appear and then, typically, be covered by the Gnuplot graphing window. No further operations can be done until the dialog box is closed. Move the Gnuplot window to uncover the dialog box and close the dialog box. Note that the dialog box is "complaining" that there are undefined values. This makes a good teaching point about the domain of the function.

The initial result is less than satisfactory.

While Qalculate! does not allow control of the range from a Qalculate! dialog box, the Gnuplot window allows one to zoom in using a drag of the right mouse button. Hold down the right mouse button and drag along the x-axis to narrow the range as seen in the image below. When you have the desired range, release the right mouse button and click with the left mouse button to execute the crop.

If you make an error, click on the blue left arrow at the top of the Gnuplot window to return to the previous zoom setting. Note that these screenshots are from Ubuntu Hardy Heron 8.04.
The result should be a proper rendition of the rational function.

If the function appears segmented, try increasing the sampling to 1000.

Qalculate! running on a desktop showing a plot. Also open is Maxima, a command line driven symbolic algebra software package.

Qalculate! uses Gnuplot as its plotting add-in, both are on the computers in the A204 computer laboratory. Gnuplot is a separate program which can be driven from its own command line. In the screenshot one can also see Maxima in the background multiplying complex factors.
All Qalculate! screenshots were taken on a Redhat Fedora V Linux box running Gnome.