| Course Title | Level | Campus |
|---|---|---|
| Calculations and mathematics using spreadsheets and databases | Pre-Juniors | Kosrae |
Course introduces students to spreadsheets using Microsoft Excel. Course also integrates arithmetic and algebraic concepts, reinforcing student knowledge of mathematics. The course will also look at Access as a means of storing data.
| Monday | Orientation | ||||||||||
|---|---|---|---|---|---|---|---|---|---|---|---|
| Tuesday | Pretest | ||||||||||
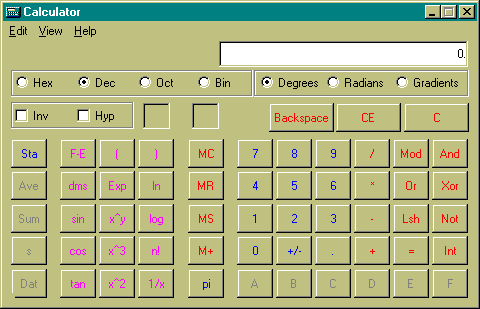
| Wednesday | Calculator • View • Clear • arithmetic ops • reciprocal • powers • roots • base changes • | ||||||||||
| Thursday | Introduction to Excel Layout • Columns • Rows • Cells • Address system • Data entry • Arithmetic formulas • Address based formulas • Sum function • Fill right • | ||||||||||
| Friday |
Dan Bricklin VisiCalc Copying functions ZXCV: Undo, Cut, Copy, Paste
|
| Monday | Review quiz. •
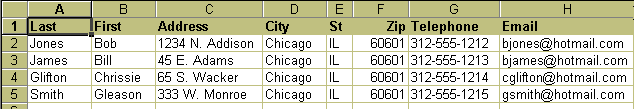
Layout and design considerations for Excel Planning • Design • Label row • No blank rows • No blank columns Students entered address lists. |
|---|---|
| Tuesday | Prepare master merge document using Microsoft Word. Insert merge fields. Perform merge. |
| Wednesday | If then else including isblank() |
| Thursday | Choose function |
| Friday | Quiz two. Conditional function: add a gender column and a comment that varies by gender. If then else. Insert new column, enter function. |
| Monday | Tuesday | Wednesday | Thursday | Friday | ||||||||||||||||||||||||||||||||||||||||||||||||||||||||||||||||||||||||||||||||
|---|---|---|---|---|---|---|---|---|---|---|---|---|---|---|---|---|---|---|---|---|---|---|---|---|---|---|---|---|---|---|---|---|---|---|---|---|---|---|---|---|---|---|---|---|---|---|---|---|---|---|---|---|---|---|---|---|---|---|---|---|---|---|---|---|---|---|---|---|---|---|---|---|---|---|---|---|---|---|---|---|---|---|---|---|
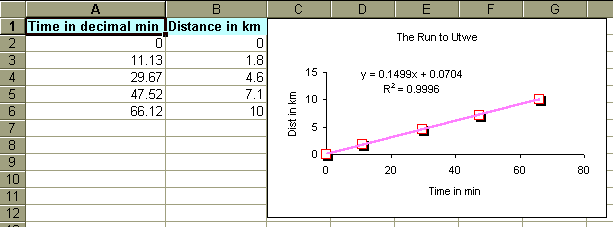
Data entry and cell formatting. Decimal places. (Utwe run
data 05 Jul 2003 16:56). XY Scatter graph.
|
Obtain best fit line. Add Trendline: Linear regression. Show equation. |
Predicting distance from time Inverse functions: predicting time from distance Biology lab regression. |
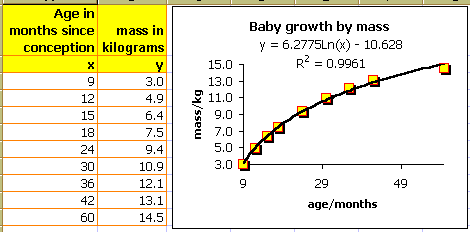
Non-linear functions. Population growth and baby growth
|
Midterm | ||||||||||||||||||||||||||||||||||||||||||||||||||||||||||||||||||||||||||||||||
| Monday | Reviewed midterm Introduced the random number generator. =int(rand()*2+1) to model the flipping of a coin. =choose(A1,"heads","tails") in cell A2 to make "concrete the model." |
|---|---|
| Tuesday | Random number generator function to model six-sided dice =int(rand()*6+1). Modeling one die, two dice. The sum of two dice. 216 pairs of dice. Introduced statistical concepts of min, max, range, count, and mode. |
| Wednesday | Continued to introduce statistical concepts: median, mean, standard deviation. |
| Thursday | Creating a histogram. Using the possible dice outcomes (2 to 12) for bins, and the frequency function to automatically results. Creating a column chart with a gap width of zero. |
| Friday | Quiz three |
| Monday | Review quiz |
|---|---|
| Tuesday | Creating subtotals. |
| Wednesday | Loaded entrance.xls. [This effort required the whole period. Some could download the file, but many had to have the file transfered from a USB key.] End of period: running subtotals on the entrance file. |
| Thursday | Pivot tables |
| Friday | Quiz four |
| Monday | Graphing polynomials |
|---|---|
| Tuesday | Review |
| Wednesday | Final |