Key
📖 Links to textbook sections
▶️ Video explanations
🔗 Link to a web page
▶️ 0.71 Calendar and tech introduction
📖 1.0 Intro
▶️ 1.0 Brief introduction to MS 150 Statistics
📖 1.1 Samples
▶️ 1.1 Population, samples, sample size n
📖 1.2 Levels
▶️ 1.2 Types and Levels of Measurement
📖 2.1 Measures of middle
▶️ 2.1 Measures of middle
📖 2.2 Spread and variation:
▶️ 2.2 Spread and variation
🔗 BoxPlotR tool
📖 2.3 Sample standard deviation
▶️ 2.3 Sample standard deviation
📖 2.4 Variables
▶️ 2.4: Variables
📖 2.5 z-scores
▶️ 2.5 Z-scores
📖 3.1 Charts
▶️ 3.1 Charts in the Google Sheets app
📖 3.2 Nominal histograms
▶️ 3.2 Nominal level histograms
📖 3.3 Ratio histograms
▶️ 3.3 Ratio level histogram
▶️ 3.3 Ratio level frequency table
📖 3.4 Distribution shape
▶️ 3.4 Shape of ratio level histograms
▶️ 3.4 Ratio level histograms in Google Sheets desktop
📖 4.1 Paired variables
▶️ 4.1 Paired linearly dependent variables
📖 4.2 Slope Intercept
▶️ 4.2 Slope and intercept functions for a linear regression
▶️ 4.2 Regression lines on an xy scattergraph in Google Sheets Desktop
📖 4.3 Strength
▶️ 4.3 Qualitative nature and strength of the relationship between two variables
📖 4.4 Correlation coefficient r
▶️ 4.4 Correlation pre-content advanced organizer
▶️ 4.4 Correlation coefficient r
📖 Coefficient of Determination
▶️ 4.4 Coefficient of Determination
▶️ Correlation is not causation
📖 5.1 Probability: Equally likely outcomes
▶️ 5.1 Probability: Mathematically predictable outcomes for single toss or draw systems
▶️ 5.1 Modeling a single six-sided die with Google Sheets app
▶️ Playlist of videos that involve probability
📖 5.3 Relative frequency is probability
▶️ 5.3 Probability is relative frequency
📖 7.1 Normal distribution intro
▶️ 7.1 An introduction to the shape of randomness: the normal distribution
📖 7.2 Shape of randomness
📖 7.3 Normal curve areas
▶️ 7.3 Areas under the normal curve
📖 8.1 Sampling distribution of the mean
▶️ 8.1 Sampling distribution of the mean
📖 8.2 Standard error
📖 9.1 Point est
📖 9.2 Conf int T-dist
▶️ 9.2 Confidence intervals
📖 10.1 CI hyp test
▶️ 10.1 Confidence interval hypothesis test for an expected population mean
📖 10.2 Hyp test
▶️ 10.2 Hypothesis testing for an expected population mean
📖 10.3 P-value
▶️ 10.3 p-value for a known population mean
📖 11.1 Paired t-test
▶️ 11.1 t-test for a paired difference in sample means for dependent samples
📖 11.2 T-test independent
▶️ 11.2 Independent samples t-test for a difference of sample means
📖 11.3 Effect size
▶️ 11.3 Effect size for a significant difference of two sample means
📖 12.1 Open data exploration: Questions approach
📖 12.2 Variables analysis
📖 12.3 ODX tools
Visual aid tips
How to give an awesome PowerPoint
You * at PowerPoint
How to avoid death by PowerPoint
References
Statistics done wrong
Data sources
Baby Names SSA
StatLib
StatLib DASL
Many eyes
Google Ngram
Google data
Google Public Data Directory
Google Fusion
Real climate
Air pollution data
Straight stats •
Statsci data sets
US Data.gov
UN Data
Flowing Data
FlowingData: World gets fatter
Flowing Data: Best questions
Center for Disease Control
World Health Organization
International Diabetes Organization
International Diabetes Organization Atlas
International Monetary Fund
Pac Pol
Pacificweb.org
FSM Stat Unit
Body fat, obesity, diabetes, health links
Traditional high fat, low carbohydrate diet more beneficial to the Pacific
Body comp handout
How Lean Should You Be? - Chart
Forbes most obese nations
Global post most obese
Body Mass Index BBC
How the diabetes-linked thrifty gene triumphed with prejudice over proof
Intentional injury reported by young people in Pohnpei
Number two in marijuana usage
Most inactive nations
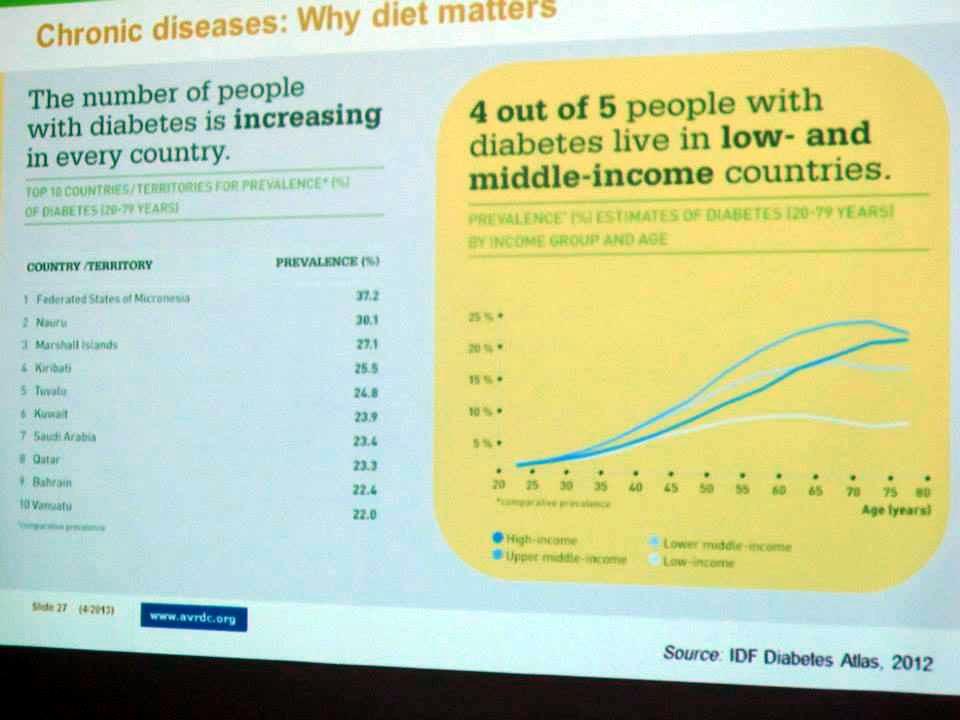
Diabetes chart image from conference