| Table One |
|---|
| First name | Frequency |
|---|
| John | 11 |
| Brandon | 9 |
| Marvin | 8 |
| Michael | 8 |
| Brenda | 7 |
| Anthony | 6 |
| Vanessa | 6 |
| Clinton | 5 |
| David | 5 |
| Jayleen | 5 |
| Jessica | 5 |
| Jonathan | 5 |
| Jordan | 5 |
| Patrick | 5 |
test 01 sc3 Name:
Seventeen or eighteen years ago parents were carefully choosing names for their newly born children. The spring COMET entrance test provided an opportunity to explore the most popular baby names of that time. The data is the popularity of the shown name based on number of students who took the COMET with that name.
- ____________________ Determine the level of measurement for the data in table one.
- __________ Determine the mode for the data in table one.
- __________ Based on table one, calculate the sample size n for table one.
In a recent interview Paul Ryan, the US Republican candidate for the vice presidency, was asked his marathon time. Ryan responded, "Under three, high twos. I had a two hour and fifty-something. ... I was fast when I was younger, yeah." Runnersworld magazine did some checking and determined that Ryan had run only one marathon in not a sub-three hour time but rather 4:01:25. Ryan's campaign staff have tried to explain that he either mispoke or had forgotten. Runners, however, have been unconvinced. Runners remember their times. I know my half marathon times. I not only know my times, but I have them recorded in my running logs. The time data in table two comes from those logs. And these are real times, not Ryan adjusted times. Use the time data in the second column of table two (not the dates!) to answer the remaining questions.
| Table Two |
|---|
| Date | Time in minutes |
|---|
| Sunday, April 02, 2000 | 120 |
| Saturday, July 21, 2007 | 135 |
| Saturday, July 19, 2008 | 132 |
| Saturday, August 22, 2009 | 127 |
| Saturday, September 04, 2010 | 147 |
| Saturday, January 14, 2012 | 143 |
| Saturday, September 08, 2012 | 133 |
- __________ Calculate the sample size n.
- __________ Calculate the minimum.
- __________ Calculate the maximum.
- __________ Calculate the range.
- __________ Calculate the midrange.
- __________ Calculate the mode.
- __________ Calculate the median.
- __________ Calculate the mean.
- __________ Calculate the first quartile.
- __________ Calculate the third quartile.
- __________ Calculate the Inter-Quartile Range.
- __________ Calculate the sample standard deviation.
- __________ Calculate the sample coeficient of variation.
- __________ The runner who came in first on Saturday 08 Sep ran the half in 89 minutes. Calculate the z-score for 89 minutes using the mean and sample standard deviation of my times.
 Make a sketch of the box plot for this time data.
- __________ If the time data is divided into three classes,
what is the width of a single class?
-
Determine the frequency and calculate the relative frequency for the data using three classes.
Record your results in the table provided.
| Class upper limits | Frequency F | Rel. Freq. |
|---|
| | |
| | |
| | |
| Sums: | | |
-
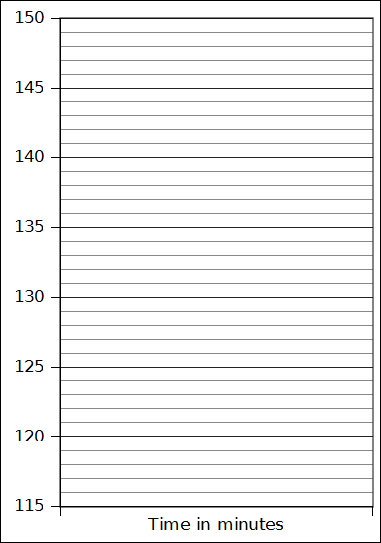
Sketch a frequency histogram for the time data,
labeling your horizontal axis and vertical axis as appropriate.
- What is the shape of the histogram?