| SMS per day |
|---|
| 3 |
| 4.5 |
| 5 |
| 5 |
| 5 |
| 5 |
| 6 |
| 7 |
| 7 |
| 8 |
| 8 |
| 9 |
| 10 |
| 10 |
| 10 |
| 10 |
| 20 |
| 20 |
| 25 |
| 25 |
| 27 |
MS 150 Statistics quiz five • Name:
The table is a trimmed sample for the number of short message service (SMS) text messages sent per day by students who send text messages in MS 150 Statistics and SC 130 Physical Science. My most sincere thanks to the students in these courses for their assistance in gathering this data.
Helpful tip: Values equal to the bin upper limit go into that bin. That is, the bin upper limit includes data "up to and including the bin upper limit."
- __________ What is the level of measurement?
- __________ Find the sample size n.
- __________ Find the minimum.
- __________ Find the maximum.
- __________ Find the range.
- __________ Find the midrange.
- __________ Find the mode.
- __________ Find the median.
- __________ Find the sample mean x.
- __________ Find the sample standard deviation sx.
- __________ Find the sample coefficient of variation CV.
- __________ If this data is divided into six bins, what is the width of a single bin?
- Determine the frequency and calculate the relative frequency using six bins. Record your results in the table provided.
| Ball bounce bin upper limits | Frequency F | Relative Frequency p(x) |
|---|
| | |
| | |
| | |
| | |
| | |
| | |
| Sums: | | |
- Sketch a relative frequency histogram of the data, labeling your horizontal axis and vertical axis as appropriate. Use the back of this sheet if necessary.
- __________ What is the shape of the histogram?
- p(x ≤ 7) = __________ What is the probability that the number of text messages sent per day by a student is less than or equal to seven?
- p(19 < x ≤ 23) = __________ What is the probability that the number of text messages sent per day by a student is more than 19 but less than or equal to 23?
- p(student has cell phone) = __________ Of sixty students surveyed, thirty students provided information on their cell phone usage. If every student who had a cell phone provided cell phone information, what is the probability that a student has a cell phone based on this sample?
- The probability that an FSM resident has a cell phone is estimated at 13% to 19%. Based on the above, are students more likely to have a cell phone or less likely to have a cell than the national probability?


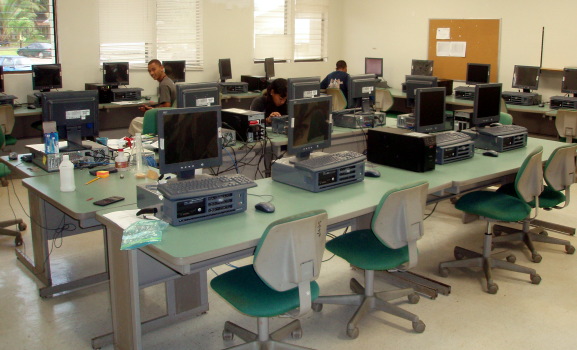
Typical morning start: at 8:03:48 three of nineteen have made it to class
Statistics •
Courses •
COMFSM
