Statistics Quiz 07 fall 2006 7.3a • Name:
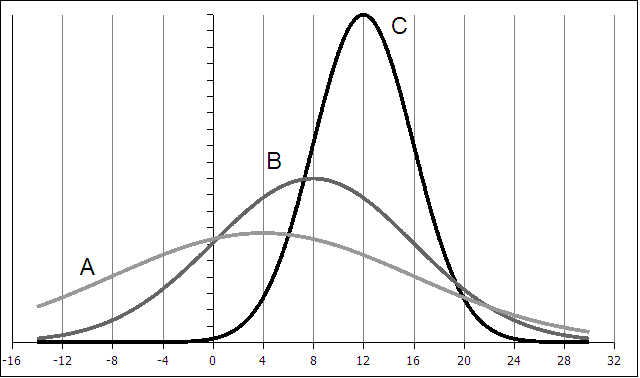
- The figure below depicts six curves:

Which, if any, of the curves in the figure above look(s) like a normal curve? If the curve is a NOT normal curve, tell why.
- 1. For the following curves A, B, and C determine the mean µ and the standard deviation
σ:
| Curve | Mean µ | standard deviation σ |
|---|
| A | | |
|---|
| B | | |
|---|
| C | | |
|---|
3. On the eighth of October I joggled 18 laps of the track. I had a mean lap time of µ = 2.5 minutes with a standard deviation of σ = 0.25 minutes. My lap times were normally distributed.
- p(x ≤ 2.5 minutes) = __________ What is the probability a lap had a time of 2.5 minutes or less?
- p(x ≤ 2.25) = __________ What is the probability that a lap was 2.25 minutes or less?
- __________ Of the 18 laps, how many were 2.25 minutes or less?
- p(x ≥ 2.67) = __________ What is the probability that a lap was 2.67 minutes or more? Use OpenOffice to answer this!
- p(2.33 ≤ x ≤ 2.67) = __________ What is the probability that a lap was more than 2.33 and less than 2.67? Use OpenOffice to answer this!
- __________How many of the laps were between 2.33 and 2.67 minutes? Use OpenOffice to answer this!
| Normal Statistics |
| Calculate a z value from an x |
z |
=  |
=STANDARDIZE(x;µ;σ) |
| Calculate an x value from a z | x |
= z σ + µ | =z*σ+µ |
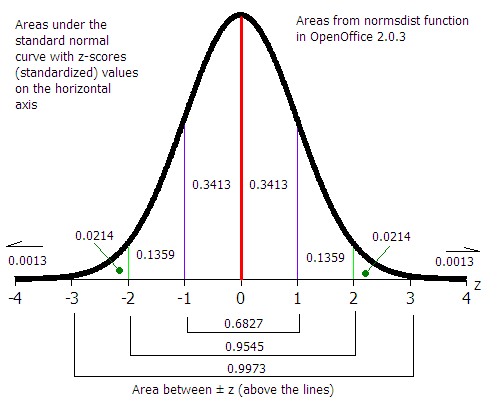
| Find a probability p(x) from a z value where the probability p is the area to the left of z. |
| |
=NORMSDIST(z) |
Statistics •
Courses •
COMFSM