MS 150 Statistics Spring 2004 Mx • Name: _____________________
In the ocean!
Basic statistics, Frequencies, histograms, and Probabilities
Malem
Reef
Flat
Wave height/
meters |
|---|
| 0.8 |
| 1.0 |
| 1.2 |
| 1.5 |
| 1.2 |
| 0.5 |
| 0.8 |
| 0.8 |
| 1.0 |
| 1.2 |
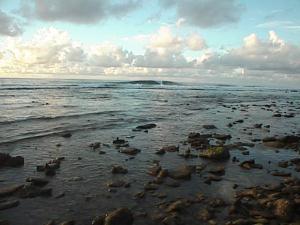
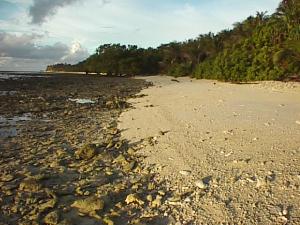
On last Wednesday evening I went for a swim in the ocean off the coast of Piyuul, Malem, Kosrae. Malem has a fringing reef, there is no lagoon. Open ocean waves travel across the reef shelf at high tide. I measured the vertical height of ten waves from their trough to their crest as I was tossed about reef flat.
- __________ Find the sample size n for the wave height data.
- __________ Find the minimum wave height.
- __________ Find the maximum wave height.
- __________ Find the range of the wave height.
- __________ Find the median wave height.
- __________ Find the mode for the wave height.
- __________ Find the sample mean wave height.
- __________ Find the sample standard deviation wave height.
- __________ Find the sample coefficient of variation CV.
- __________ If this data were to be divided into five bins, what would be the width of a single bin?
- Determine the frequency and calculate the relative frequency using five bins. Record your results in the table provided.
Frequency table
| Bins (x) | Frequency (f) | P(x) |
|---|
| _______ | _______ | _______ |
| _______ | _______ | _______ |
| _______ | _______ | _______ |
| _______ | _______ | _______ |
| _______ | _______ | _______ |
| Sum: |
_______ | _______ |
- Sketch a relative frequency histogram of the data here or on the back, labeling your horizontal axis and vertical axis as appropriate.
- __________ What is the shape of the distribution?
- __________ Determine P(x <= 0.7 meters)
- __________ Determine P(x > 1.3 meters)
Calculation of Mean from Frequency Table
- The senior class of 2004 at KHS had the following reading score distribution on the entrance test. Use this data to find the KHS mean reading score for the class of 2004.
KHS Reading Analysis
| bins | Freq | RF or P(x) | Mean calc |
|---|
| 360 | 17 | 0.1049 | __________ |
| 410 | 59 | 0.3642 | __________ |
| 460 | 65 | 0.4012 | __________ |
| 510 | 19 | 0.1173 | __________ |
| 560 | 2 | 0.0123 | __________ |
| Sums: | 162 | 1.0000 | __________ |
|---|
Mean reading score for KHS class of 2004: _______________
- __________ A score above 460 is considered good enough to come to the national campus. How many students were above 460 in the KHS class of 2004?
Linear regression
On the Thursday evening in Malem, Kosrae, I measured the depth of the water on the reef shelf versus the velocity of the waves in meters per second.
Depth versus wave velocity
| Depth/meters | Velocity/(m/s) |
|---|
| 0.0 | 0.00 |
| 0.3 | 1.73 |
| 0.6 | 2.45 |
| 0.9 | 3.00 |
| 1.2 | 3.46 |
| 1.5 | 3.87 |
- __________ Calculate the slope of the linear trend line (also known as best fit line, least squares, linear regression) for the depth versus velocity data.
- __________ Calculate the y-intercept for the data.
- __________ Is the correlation positive, negative, or neutral?
- __________ Do waves move faster in deeper or shallower water?
- __________ Determine the correlation coefficient r.
- __________ Is the correlation none, low, moderate, high, or perfect?
- __________ Determine the coefficient of determination.
- __________ What percent in the variation in depth explains the variation in velocity?
- __________ Based on the equation of the trend line, what would be the predicted velocity of a wave in water 1.05 meters deep?
- __________ Lee Ling jogs at 2.5 meters per second. Based on the equation of the trend line, what would be the predicted depth of water for a wave moving at 2.5 meters per second?
- __________ Does the relationship appear to be linear or non-linear?
Table of statistical functions used by Exce
| Statistic or Parameter |
Symbol |
Equations |
Excel |
| Square root |
|
|
=SQRT(number) |
| Sample mean |
x |
Σx/n |
=AVERAGE(data) |
| Sample standard deviation |
sx |
|
=STDEV(data) |
| Sample Coefficient of Variation |
CV |
100(sx/x |
=100*STDEV(data)/AVERAGE(data) |
| Slope |
b |
|
=SLOPE(y data, x data) |
| Intercept |
a |
|
=INTERCEPT(y data, x data) |
| Correlation |
r |
|
=CORREL(y data, x data) |
| Coefficient of Determination |
r² |
|
=(CORREL(y data, x data))^2 |
__________ Do you use the textbook?
__________ Do you find the textbook to be helpful?
What would be your comments on changing from using the textbook to having the students purchase bound copies of the class notes from the bookstore for next Fall?