Part One: Footfalls • Name:

The number of footsteps for ten Mondays as recorded by a clip on pedometer are shown in the table.

Pedometer data
Monday Footsteps
9972
7777
8412
9307
6974
9647
8881
6866
6575
10175

For the number of footsteps on the ten Mondays above:

  1. _________ Determine the sample size n.
  2. _________ Calculate the sample mean x.
  3. _________ Determine the median.
  4. _________ Determine the mode.
  5. _________ Determine the minimum.
  6. _________ Determine the maximum.
  7. _________ Calculate the range.
  8. _________ Calculate the sample standard deviation sx.
  9. _________ Calculate the sample Coefficient of Variation.
  10. _________ Determine the class width. Use 5 bins (classes or intervals)
  11. Fill in the following table with the class upper limits in the first column, the frequencies in the second column, and the relative frequencies in the third column
    Bins Frequency Relative Frequency f/n
    _________ _________ _________
    _________ _________ _________
    _________ _________ _________
    _________ _________ _________
    _________ _________ _________
    Sums: _________ _________
  12. Sketch a histogram of the relative frequency data on the back of the paper.
  13. _________ What is the shape of the distribution?
  14. _________ Using the relative frequencies in the table above, what is the probability that a Monday will have 9456 or more footsteps?
  15. Construct a 95% confidence interval for the population mean µ footsteps for Monday. Note that n is less than 30. Use the sample size, sample mean and sample standard deviation from questions one, two, and eight above to generate your t-critical tc and error tolerance E.
    1. __________ How many degrees of freedom?
    2. __________ What is tc?
    3. The error tolerance E = _______________
    4. The 95% confidence interval for the Monday mean µ is ____________ ≤ µ ≤ ____________
  16. __________ Suppose a population mean number of footsteps for any day of the week is found to be 7660 footsteps. Based on the above data and a 95% confidence level, is the Monday mean statistically significantly different at a confidence level of 95% from 7660 footsteps?
  17. __________ Using 7660 footsteps as the population mean and the sample size, sample mean and sample standard deviation from questions one, two and eight, calculate the t-statistic .
  18. __________ Determine the p-value using the t-distribution.
  19. __________ What is the largest confidence interval c for which this change is statistically significant?
  20. ________________________________________Given a null hypothesis of H0: µ = 7660 and an alternate hypothesis of H1: µ ≠ 7660, would we reject the null hypothesis or fail to reject the null hypothesis that a sample with a size specified in question one, a mean from question two, and a standard deviation as found for question eight could have come from that population at an α = 0.05.
  21. Explain the statistical meaning of alpha:

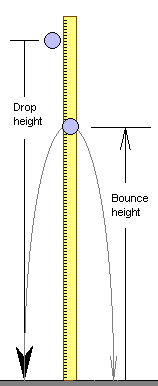
golfdropmeterstick (3K)Part Two

A golf ball was dropped from increasing heights and the bounce height for the first bounce was recorded. For example, when dropped from a height of 132 centimeters, the golf ball bounced back up 107 centimeters on the first bounce. The following table includes all of the data measurements.

Drop height/cm Bounce height/cm
00
4133
7156
132107
163124
193147
254191
  1. _________ Calculate the slope of the best fit (least squares) line for the data.
  2. _________ Calculate the y-intercept of the best fit (least squares) line.
  3. _________ Is the correlation positive, negative, or neutral?
  4. _________ Use the equation of the best fit line to calculate the predicted bounce height for a drop height of 100 centimeters.
  5. _________ Use the inverse of the best fit line equation to calculate the predicted drop height for a bounce height of 165 centimeters.
  6. _________ Calculate the linear correlation coefficient r for the data.
  7. _________ Is the correlation none, low, moderate, high, or perfect?
  8. _________ Calculate the coefficient of determination.
  9. _________ What percent of the variation in the drop height data explains the variation in the bounce height data?
  10. _________ Is there a relationship between the drop height and bounce height?
  11. _________ Can the bounce for a drop height of 500,000 centimeters (five kilometers or about 3.1 miles) be predicted?
  12. Why?
Basic Statistics
Statistic or Parameter Symbol Equations Excel
Square root     =SQRT(number)
Sample size n   =COUNT(data)
Sample mean x Sx/n =AVERAGE(data)
Sample standard deviation sx or s   =STDEV(data)
Sample Coefficient of Variation CV 100(sx/x) =100*STDEV(data)/AVERAGE(data)
Linear Regression Statistics
Statistic or Parameter Symbol Equations Excel
Slope b   =SLOPE(y data, x data)
Intercept a   =INTERCEPT(y data, x data)
Correlation r   =CORREL(y data, x data)
Coefficient of Determination r2   =(CORREL(y data, x data))^2
Statistic or Parameter Symbol Equations Excel
Normal Statistics
Calculate a z value from an x z = standardize.gif (905 bytes) =STANDARDIZE(x, µ, s)
Calculate an x value from a z x = s z + µ =s*z+µ
Calculate a t-statistic (t-stat) t xbartot.gif (1028 bytes) =(x - µ)/(sx/SQRT(n))
Calculate an x from a z   xbarfromz.gif (1060 bytes) =µ + zc*sx/sqrt(n)
Find a probability p from a z value     =NORMSDIST(z)
Find a z value from a probability p     =NORMSINV(p)
Confidence interval statistics
Degrees of freedom df = n-1 =COUNT(data)-1
Find a zc value from a confidence level c zc   =ABS(NORMSINV((1-c)/2))
Find a tc value from a confidence level c tc   =TINV(1-c,df)
Calculate an error tolerance E of a mean for n >= 30 using sx E error_tolerance_zc.gif (989 bytes) =zc*sx/SQRT(n)
Calculate an error tolerance E of a mean for n < 30 using sx. Can also be used for n >= 30. E error_tolerance_tc.gif (989 bytes) =tc*sx/SQRT(n)
Calculate a confidence interval for a population mean µ from a sample mean x and an error tolerance E   x-E<= µ <=x+E  
Hypothesis Testing
Calculate t-critical for a two-tailed test tc   =TINV(a,df)
Calculate a p-value from a t-statistic p   = TDIST(ABS(tstat),df,#tails)