- __________ Calculate the slope of the line.
- ______________ Determine the y-intercept of the line.
- y = _________ x + __________ Write the y = mx + b slope-intercept equation for the line.
- [float] or [sink] The slope of the line is the density of soap. If the density of the soap is less than one gram/centimeter³ then the soap would float. If the density of the soap is greater than one gram/centimeter³ then the soap would sink. Based on the above, will this soap float or sink?
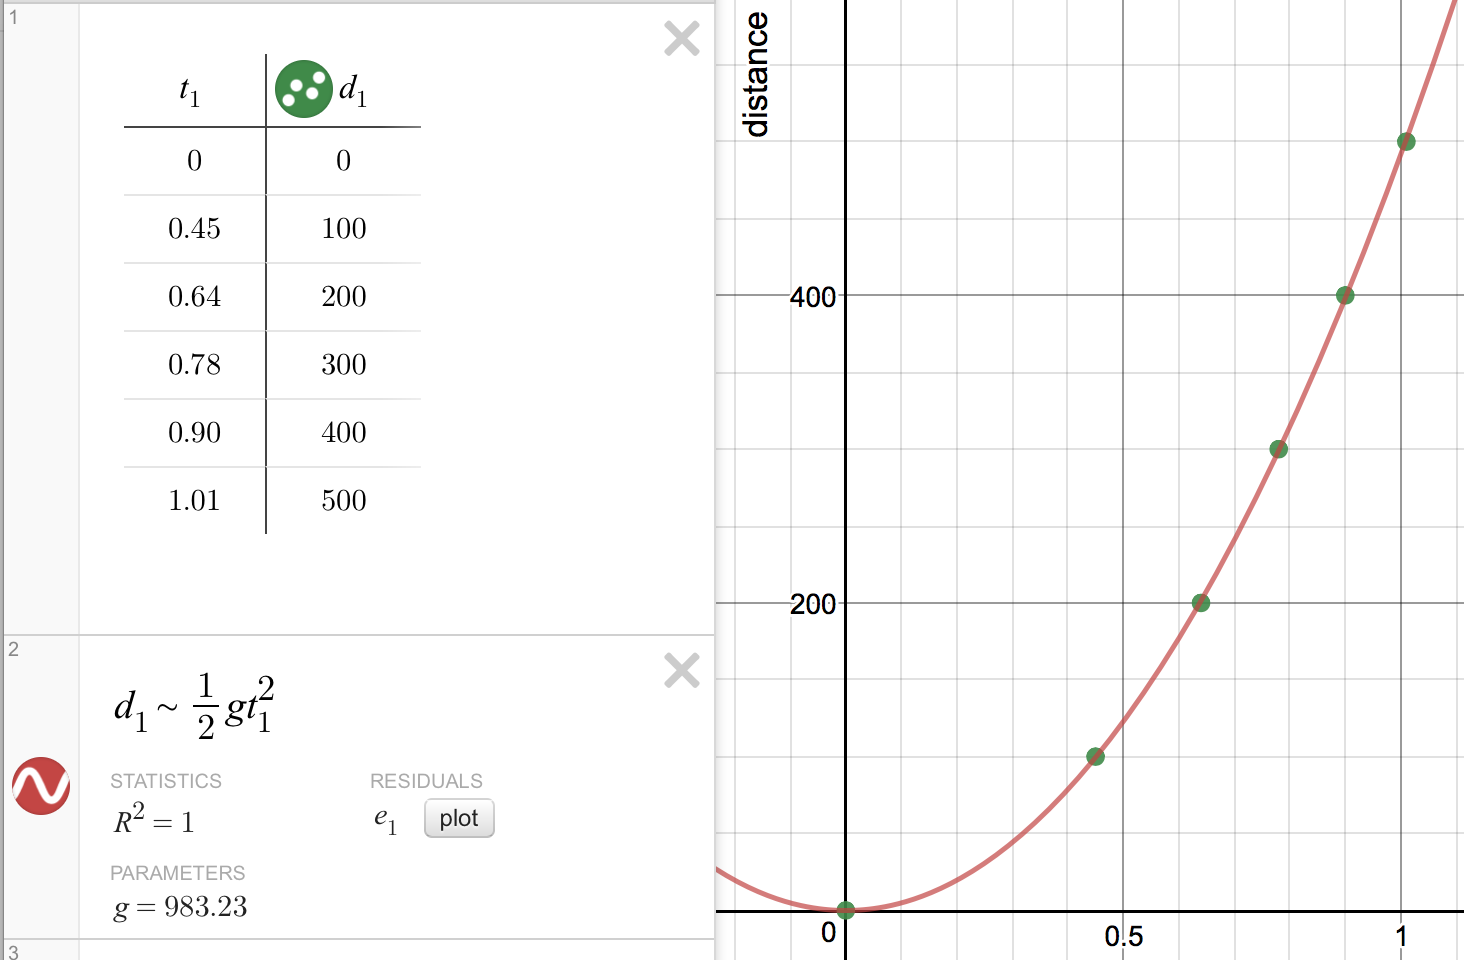
- __________ Calculate the slope of the line.
- __________ Calculate the intercept of the line.
- __________ cm. How far will the RipStik travel in 23 seconds?
- __________ seconds. How long in seconds for the RipStik to travel 7500 centimeters?

- _______________ Based on the data above, which variable has the most predictable effect on the force of friction?
- Why?
- _______________ Based on the data above, which variable has the least predictable effect on the force of friction?
- Why?
- ______________ What will be the slope of the graph for marbles in versus marbles out?
- _____________________ ____ ________________ What law of motion are the marbles demonstrating?
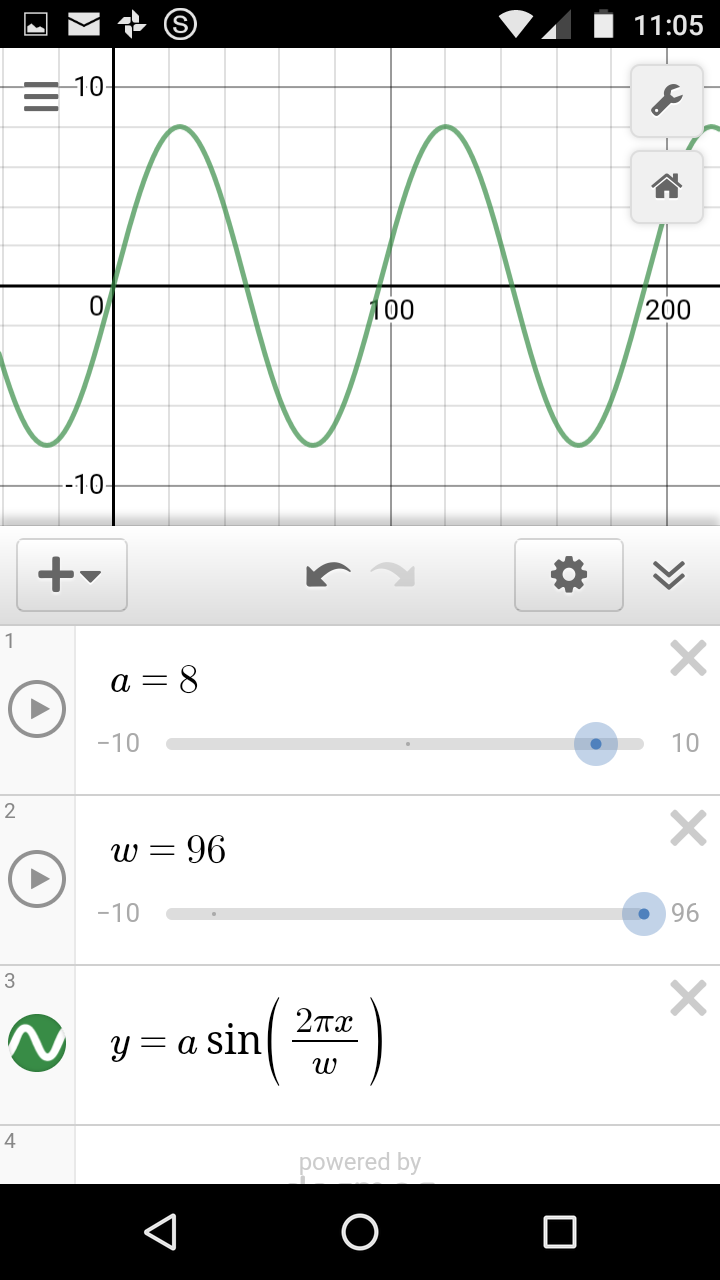
- λ = _________ _________ What is the wavelength λ of ONE wave?
- a = _________ _________ What is the amplitude a?
- τ = _________ _________ The RipStik took 1.45 seconds to swizzle (wiggle) 2.5 times. What is the period τ of ONE wave?
- f = _________ _________ What is the frequency f of the RipStik wave?
- ѵwave = _________ _________ What is the wave velocity ѵwave?
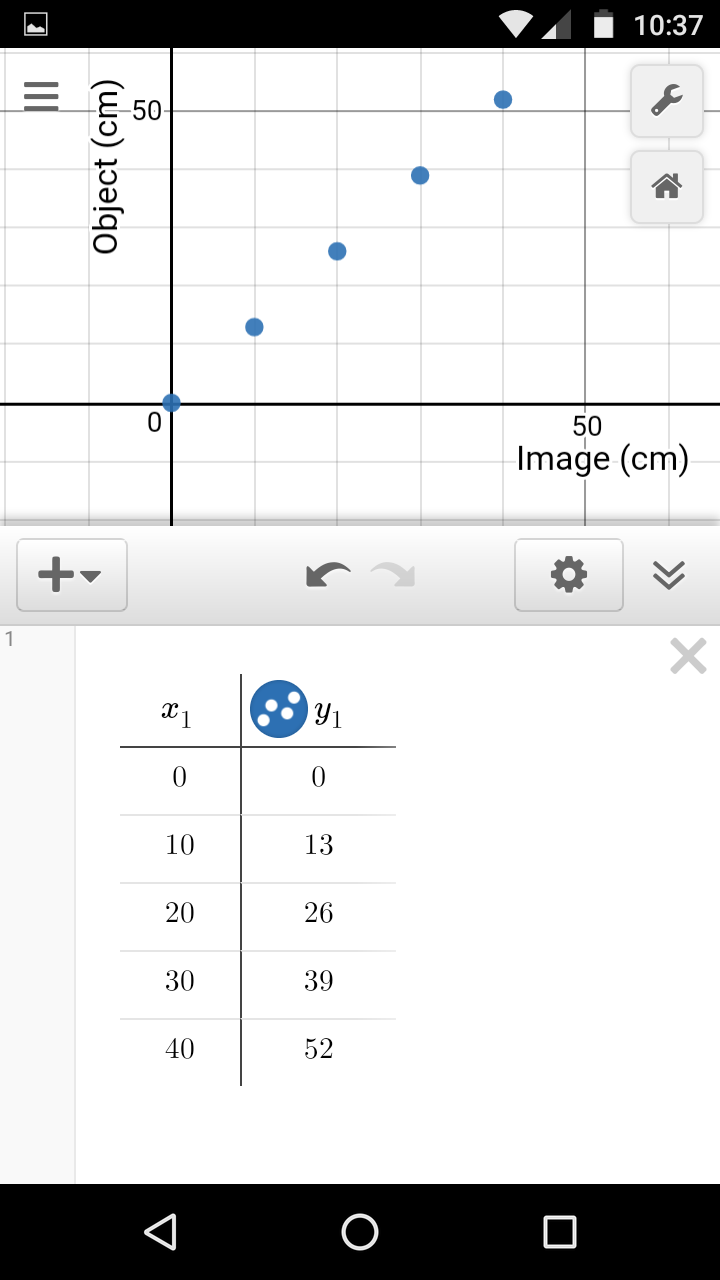 __________ Based on the image at the right (maybe on next page) where x1 is the image depth and y1 is the object depth for an object underwater, what is the index of refraction for water?
- ______________ __________ Use the index of refraction calculated above to predict the object depth for a penny that appears to be 30 cm underwater.
- ______________ __________ Use the index of refraction calculated above to predict the image depth for a coral head that is 200 cm underwater.
- ______________ Water has a published index of refraction of 1.33. What is the error for the slope?
- ______________ Water has a published index of refraction of 1.33. What is the percentage error for the slope?


- __________ _____ Given that V = iR, calculate the resistance R for the dryer.
- __________ _____ Given that P = iV, calculate the power P for the dryer.
- __________ Power is now forty cents per kiloWatt hour, or $0.40 for 1000 Watts for one hour. How much does it cost to run the dryer for one hour?
- _______________ Looking only at the atomic diagram on this paper, determine the atomic number of the atom depicted.
- _______________ Looking at the diagram, what is the atomic mass for the atom?
- _______________ Looking at the diagram and the chart on the wall, what is the one or two letter chemical abbreviation for this element?
- _______________ What is the full name for this element?

Cloud type: ______________________
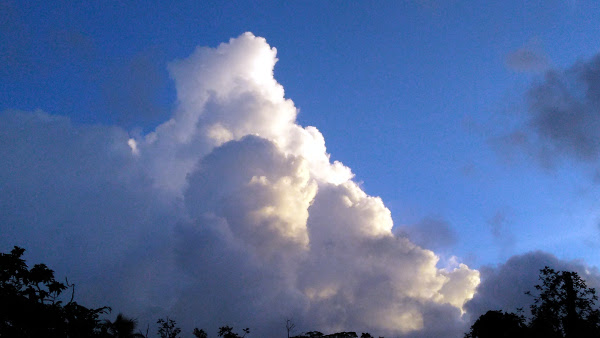
Cloud type: ______________________

Cloud type: ______________________
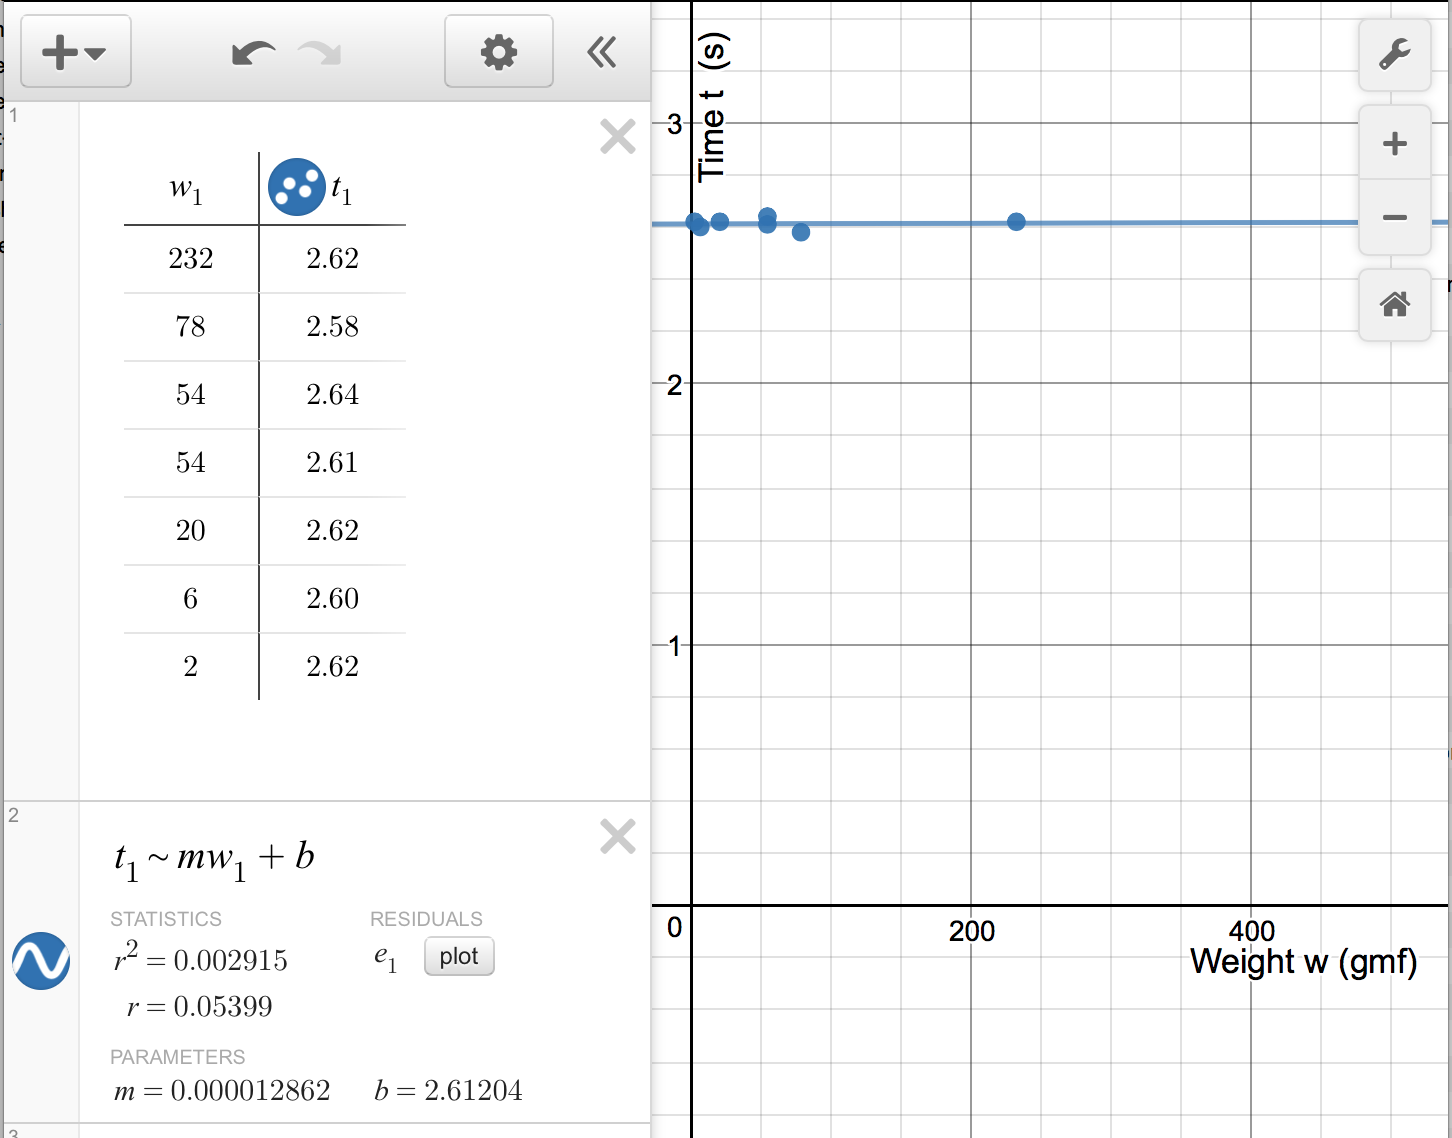
- ____________ __________ What is the slope of the relationship?
- Based on the experiment, does the time for a marble to roll down a ramp depend on the weight of the marble? Why?