 ☁: ________________________
- ☁: ________________________
- ☁: ________________________
- Define reflection.
- Define refraction.
- Define total internal reflection.
- __________ Based on the image at the right, what is the index of refraction for water?
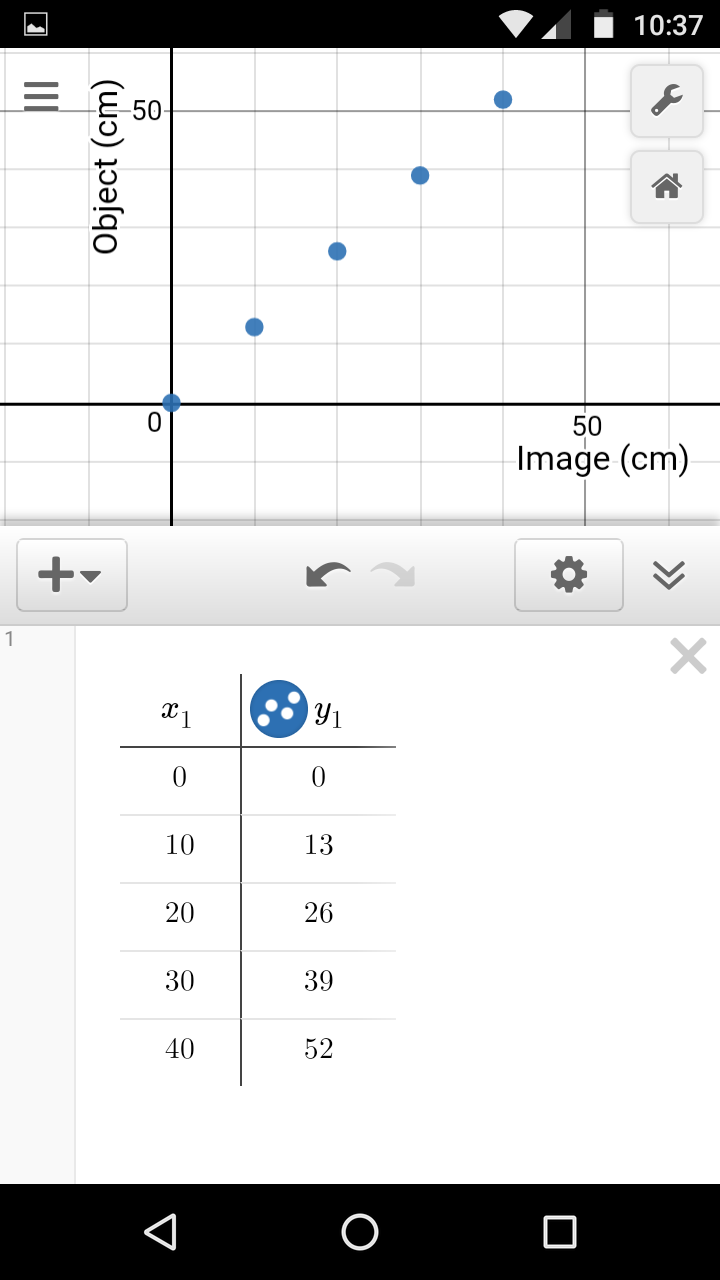
- A student gathered the data seen in the table seen further below.
- ______________ Calculate the slope of the line. The slope is the experimental index of refraction for water.
- ______________ __________ Use the slope above to predict the object depth for a penny that appears to be 30 cm underwater.
- ______________ __________ Use the slope above to predict the image depth for a coral head that is 200 cm underwater.
- ______________ Water has a published index of refraction of 1.33. What is the error for the slope?
- ______________ Water has a published index of refraction of 1.33. What is the percentage error for the slope?
error = experimental value − expected or published value ||
||