1. The graph shows soap density data. Use the graphed data to answer the following questions.
    Soap density Soap density Dial Basic Neutrana Ivory volume (cm³) mass (g) y-axis labels 0 10 20 30 40 50 60 70 80 90 100 x-axis labels 0 10 20 30 40 50 60 70 80 90 100
    1. __________ _____ Calculate the density ρ of Dial Basic soap.
    2. ______________ Based on the density, will Dial Basic soap float or sink?
    3. __________ _____ Using the density above, calculate the mass of a bar of Dial Basic soap that has a volume of 100 cm³.
    4. __________ _____ Using the density above, calculate the volume of a bar of Dial Basic soap that has a mass of 250 grams.
    5. __________ _____ Calculate the density ρ of Ivory soap.
    6. ______________ Based on the density, will Ivory soap float or sink?
    7. __________ _____ Calculate the density ρ of Neutrana soap.
    8. ______________ Critical thinking: Based on the density, will Neutrana soap float or sink?
  2. For the following RipStik velocity chart:
    Graph f(x) = 300x + 1000 RipStik time versus distance Time (seconds) Distance (centimeters) x-axis labels 0 1 2 3 4 5 6 7 8 9 10 y-axis labels 0000 1000 2000 3000 4000
    1. __________ _____ Determine the velocity ѵ of the RipStik.
    2. __________ _____ If the RipStik continued at that velocity for 30 seconds, how many centimeters would the RipStik travel?
    3. __________ _____ If the RipStik continued at that velocity for 6700 centimeters, how many seconds would the RipStik travel?
  3. __________ __________ A RipStik accelerated as in the chart. The curve on the graph is the acceleration of RipStik. Using the point D (5 seconds, 800 cm) and the equation d = ½at², calculate the acceleration of the RipStik.

    Graphical analysis background rectangle major grid lines D text layers RipStik Velocity Time (seconds) Distance (centimeters) x-axis labels 0 1 2 3 4 5 y-axis labels 0 80 160 240 320 400 480 560 640 720 800
  4. __________ __________ For the Desmos graph and regression, determine the acceleration of gravity g.
    Desmos parabolic regression
  5. A student rolled marbles into a line of five marbles.
    Marbles on ruler track
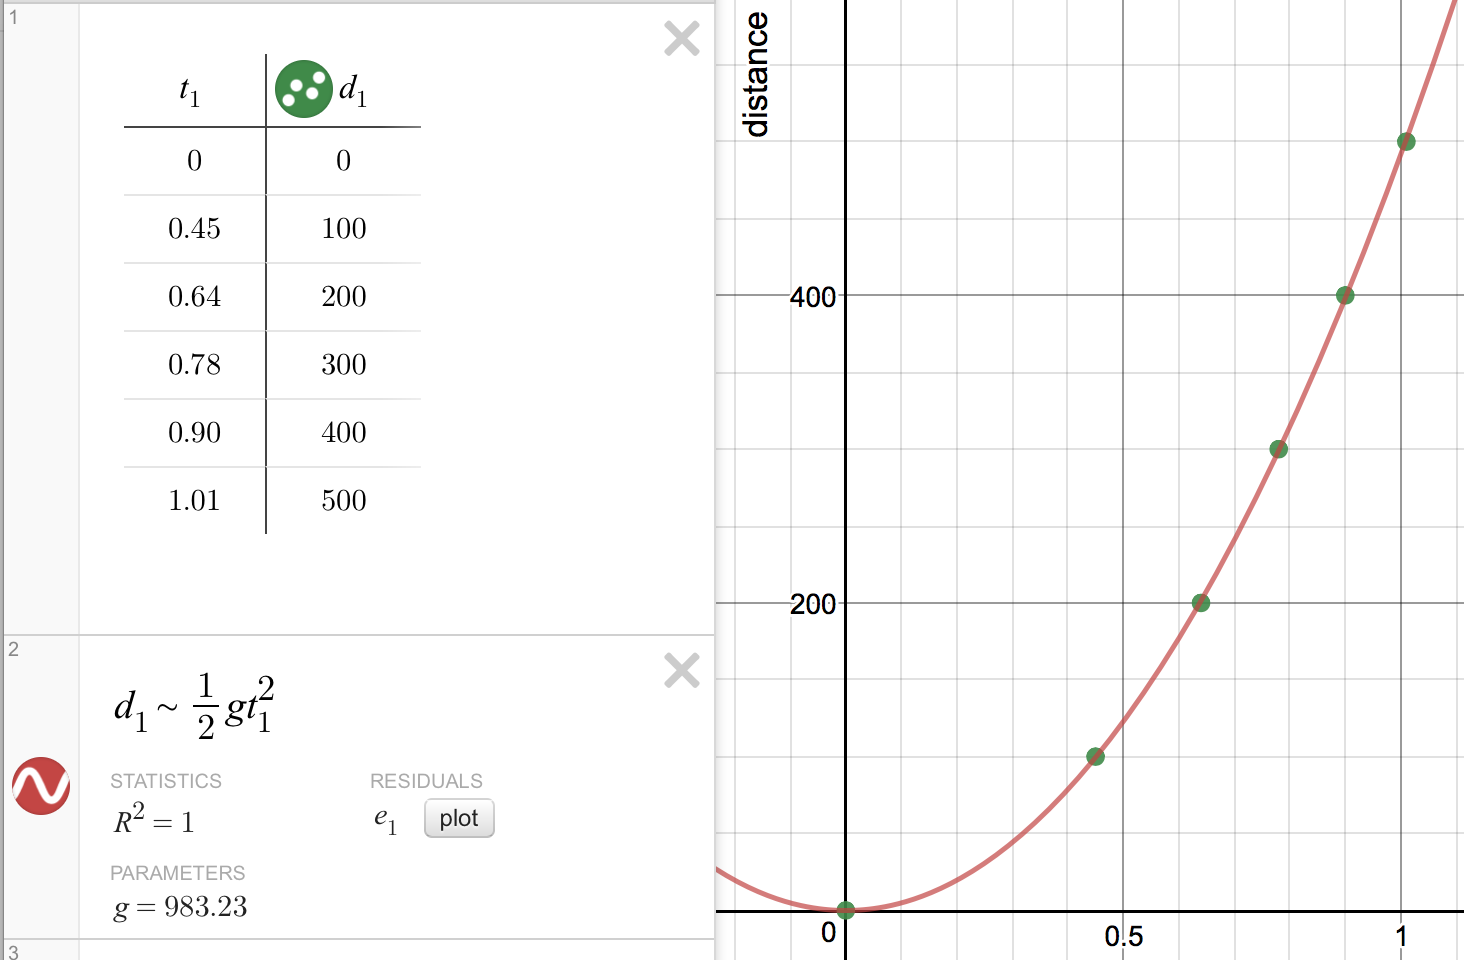
    1. ______________ What will be the slope of the graph for marbles in versus marbles out?
    2. _____________________ ____ ________________ What law of motion are the marbles demonstrating?
  6. The graphs show force of friction data for weight, grit, and surface area.
    force of friction linear regression graphs for surface area, grit, weight
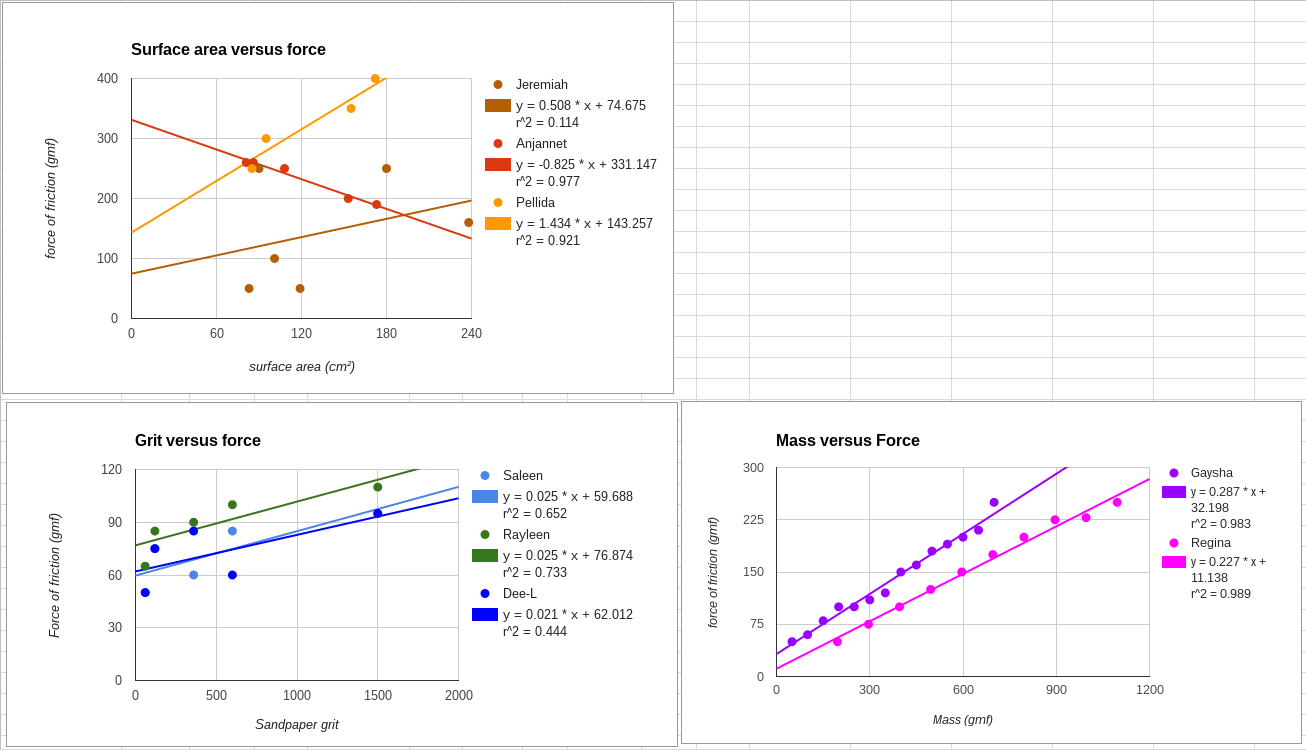
    1. _______________ Based on the data above, which variable has the most effect on the force of friction?
    2. Why?
    3. _______________ Based on the data above, which variable has the least effect on the force of friction?
    4. Why?
    5. ________ __________ For the upper line on the mass versus force chart, Gaysha's data, what will be the force of friction for a mass of 900 grams?
  7. Write the letter of the matching model.
    Math models
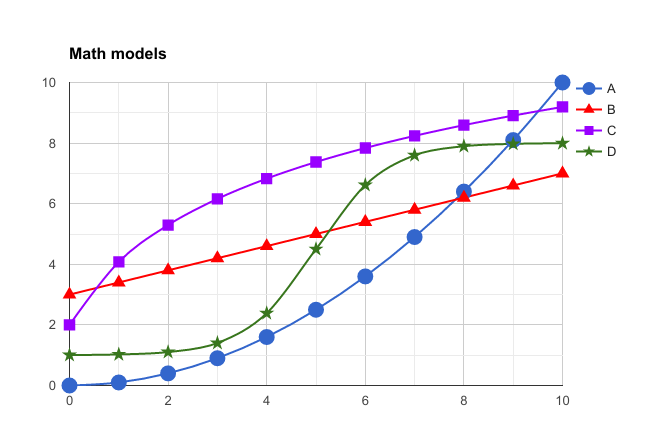
    _____ Linear _____ Quadratic (parabola) _____ Logarithmic _____ Logistic
  8. The following data is based on measurements taken on Thursday by Anjannet during laboratory seven using a GPS set to read in decimal degrees.
    Graphical analysis

    Lab seven

    Distance (degrees x 10-5)Distance (m)
    0000
    02730
    05460
    08190
    108120
    135150
    major grid lines axes text layers minutes versus meters Distance (arcmin) Distance (m) x-axis labels 0 30 60 90 120 150 y-axis labels 0 30 60 90 120 150
    1. Plot the points.
    2. ___________ ____________ Determine the slope of the line.
    3. ___________ ____________ The slope is distance in meters for the last digit of the GPS used by Anjannet. Based on the slope, how close to my location could that GPS have put a student?