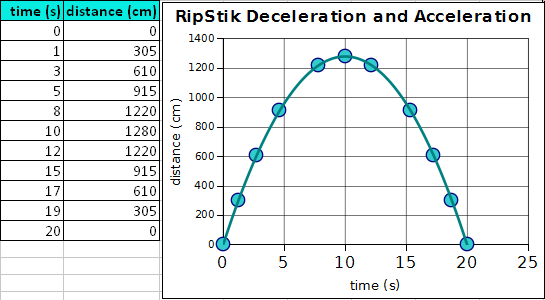
- ___________________ What is the name of the shape formed by the curve on the graph?
- ___________________ Between zero and ten seconds, what is happening to my velocity?
- ___________________ At exactly ten seconds, what is my velocity according to the graph?
- ___________________ Between ten and twenty seconds, what is happening to my velocity?
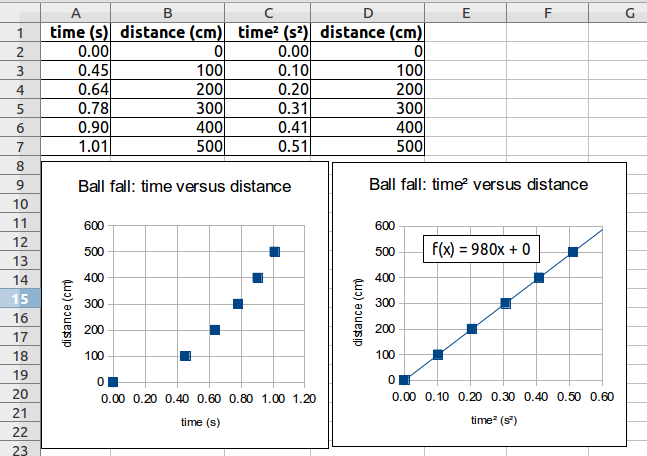
_______________ _________ According to the data and graphs, what is the acceleration of gravity?
- _________ __________ Calculate the Gravitational Potential Energy of the marble.
- _________ __________ At the bottom of the banana leaf the same marble is moving at a velocity of 100 cm/s. Calculate the Kinetic Energy of the marble.
- ______________ As a percentage of the original Gravitational Potential Energy, how much energy was lost to friction and other sources of energy loss?
- _____ Identify by the letter which of the mathematical relationships on the graph represents the time versus distance relationship for a RipStik moving at a constant linear velocity with no acceleration.
- _____ Identify by the letter which of the mathematical relationships on the graph represents the time versus distance relationship for a ball falling under the constant acceleration of gravity g.
- _____ Identify by the letter which of the mathematical relationships on the graph represents the height versus velocity relationship for a marble rolling from a height h down a banana leaf and onto a flat table.
- Plot the data provided in the table on the graph below and draw a line through the points.
- ____________ Based on the data, what is the Actual Mechanical Advantage for the pulley system?
- ____________ The pulley system had four load lines. What is the Ideal Mechanical Advantage?
- ____________ Use the preceding two questions to calculate the efficiency of the pulley system.
- ______________ What was the likely cause of the efficiency being less than 100%?