SC 130 Physical Science assessment psa3
The following document is based on the deployed outline. By using the outline as the basis for reporting assessment of learning, the document seeks to close the design-deploy-assess loop in a single document. Due to formatting complexity and the need for links to supporting evidence, this document can only logically exist as a web page. The deployed outline has turquoise background table cells, the assessment has wheat colored background table cells.
Course Description:
A one semester natural science with laboratory course exploring motion, dynamics, heat, earth sciences, weather, climate, sound, optics, light, electricity, chemistry, and astronomy, with a focus on mathematical models and an emphasis on written communication skills.
- Program Learning Outcomes (PLO):
- 1.1 Write a clear, well-organized paper using documentation and quantitative tools when appropriate.
- 3.2 Present and interpret numeric information in graphic forms.
- 3.4 Define and explain the concepts, principles, and theories of a field of science.
- 3.5 Perform experiments that gather scientific information and to utilize, interpret, and explain the results of experiments and field work in a field of science
- Course Learning Outcomes (CLO):
- Demonstrate core scientific skills
- Perform experiments in mechanics
- Perform experiments in material and earth sciences
- Perform experiments in wave based phenomena
-
| Deployed outline | Assessment |
|---|
| CLO | PLO 1.1 | PLO 3.2 | PLO 3.4 | PLO 3.5 |
PLO 1.1 | PLO 3.2 | PLO 3.4 | PLO 3.5 |
| 1a |
D |
I, D |
I |
|
01
03
05
07
09
11
13
14
|
|
| 2 | | | I,D | I,D |
|
0.56, 0.56b |
0.32, 0.26, 0.03, 0.38c |
 d
d
|
| 3 | | | I,D | I,D |
|
0.71 |
0.10 _.__e 0.18, 0.35, 0.45 |
|
| 4 | | | I,D | I,D |
|
|
0.16, 0.03, 0.13, 0.11 |
|
| CLO | PLO 1.1 | PLO 3.2 | PLO 3.4 | PLO 3.5 |
|---|
| 1 | 1.3 | 1.2 | 1.1 |
|
| 2 | | |
2.1 2.2 2.3 2.4 | 2.1 2.2 2.3 2.4 |
| 3 | | |
3.1 3.2 3.3 3.4
3.5f
|
3.1 3.2 3.3 3.4
3.5f
|
| 4 | | |
4.1 4.2 4.3 4.4 | 4.1 4.2 4.3 4.4 |
- Student Learning Outcomes (SLO):
CLO1 Demonstrate core scientific skills
| Student learning outcomes | Assessment strategies |
Assessmentg |
| 1.1 Explore physical science systems using scientific methodologies |
Completion of laboratory
reports as per format
specified in text.
Six of eight
(75%) must be completed.
|
Lab report completion rate overall: 390 laboratories of 416 for a 94% completion rate.
Sample laboratories:
01
03
05
07
09
11
13
14
|
| 1.2 Generate mathematical models for physical science systems |
| 1.3 Write up the results of experiments in a formal format using spreadsheet and word processing software |
CLO2 Perform experiments in mechanics
| Student learning outcomes | Assessment strategies | Assmt |
|---|
| 2.1 Determine the relationship between time and space for an object undergoing linear motion |
Laboratory reports,
quizzes, tests.
60% Passing as per
2009-2011 catalog |
0.50h
|
| 2.2 Determine the relationship between time and space for an object undergoing accelerated motion |
0.46
lab03i
|
| 2.3 Measure momentum and determine whether momentum is conserved in a collision |
0.03
|
2.4 Determine whether a material is linear elastic
Calculate forces, determine whether a material is linear elasticj
|
0.38
lab05
|
CLO3 Perform experiments in material and earth sciences
| Student learning outcomes | Assessment strategies | Assmt |
|---|
| 3.1 Determine the heat conductivity of different materials |
Laboratory reports,
quizzes, tests.
60% Passing as per
2009-2011 catalog |
0.40
|
| 3.2 Determine the electrical conductivity of different materials | NA
|
| 3.3 Calculate the relationship between minutes of latitude and meters | 0.18
lab07
|
| 3.4 Identify different types of precipitation and clouds | 0.35
|
| 3.5 Identify whether solutions are acidic or basic | 0.45
lab13
|
CLO4 Perform experiments in wave based phenomena
| Student learning outcomes | Assessment strategies | Assmt |
|---|
4.1 Measure the speed of sound
Determine wavelength, frequency, period, amplitude for waves and measure the speed of soundj
|
Laboratory reports,
quizzes, tests.
60% Passing as per
2009-2011 catalog |
0.13
lab09
|
| 4.2 Identify continuous and discrete spectra, list the orders of colors in spectra, and explore the combinations of primary colors of light used to produce secondary and other colors of light. |
0.13
|
| 4.3 Determine the relationships for optical depth behind a mirror and below the surface of water |
0.03
lab11k
|
| 4.4 Determine the relationship between current and voltage for an electrical circuit |
0.11
|
Notes
a CLO 1 assessment is evidenced by the laboratory reports. Sample laboratory reports by different students from the odd laboratories plus the laboratory practical are linked as evidence. The files are Adobe Acrobat portable document format files.
b CLO 2, 3, and 4 were not originally expected to produce PLO 3.2 evidence. The number cited is the percent of students answering correctly on the final examination based on an item analysis. The two percentages refer to SLO 2.1 and SLO 2.2.
c The number cited is the percent of students answering correctly on the final examination based on an item analysis. The four percentages refer to SLOs 2.1, 2.2, 2.3, and 2.4 as per the mapping given in the next table in that section.
d PLO 3.5 says "perform experiments that gather..." CLOs 2, 3, and 4 intentionally reuse the verb "perform". The evidence that students performed the experiments is photographic evidence at the links provided under PLO 3.5. Triangulation is provided by the item analysis percentages listed under PLO 3.4 and sample student laboratory reports which are linked from CLO 1 in table C.
e No question on the final mapped to SLO 3.2
f SLO 3.5 was included in section D but not in section C.
g These assessments directly reflect those reported in the section C table.
h The 0.50 means that 50% of the students answered questions on CLO 2.1 correctly based on an item analysis of the final examination. The 0.50 is a result of the average of 0.56 and 0.32 in section C, CLO 2, PLO 3.4 and PLO 3.5. The average is not the midpoint because there were more questions which mapped to PLO 3.5 than to PLO 3.4. This applies to other values reported in these columns.
i Sample student laboratories are only provided for odd numbered laboratories. Although fall term featured 13 laboratory reports, both even and odd laboratories, the work load of 32 essays to be marked each and every single weekend remains a serious barrier to any other instructor attempting the course. Spring 2011 will shift to having students write up only the odd numbered laboratory reports. A study will be done on the impact on the writing will be done to see if this impacts the improvement seen in grammar under the current system.
j This is a proposed changing in the wording of the outcome as a result of the assessment.
k Laboratory ten fall 2010 will be laboratory eleven spring 2011. Fall 2010 eleven was already a "no write-up laboratory" and thus will be shifted to be laboratory ten spring 2011. Note that laboratory one is an "introduction" to labs and lab equipment and centers on density. Laboratory 14 is a practical examination laboratory exercise. Sample labs are included in section C above, but not in D.
Discussion
The final last spring was NOT correlated to the laboratory report score average (p = 0.1566):
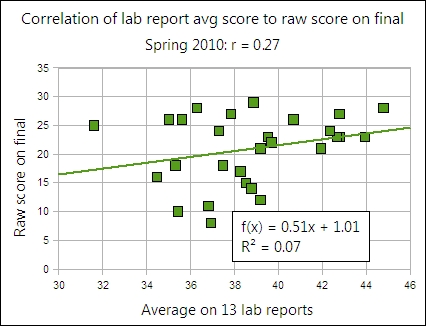
The final was completely redesigned and restructured to better reflect the laboratories. Questions were also moved up Bloom's taxonomy from prior terms. Where prior term final examinations had focused on calculations, this term the questions asked students to make inferences and draw conclusions.
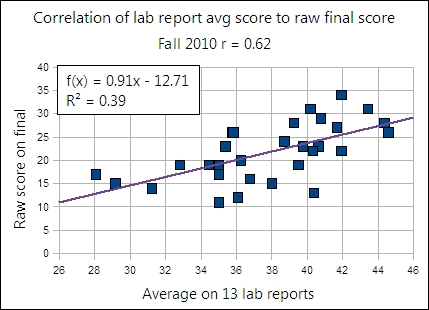
This fall 2010 term the final was correlated to the laboratory average (p = 0.0002)
The final fall 2010 also correlated with the overall course average, that it, the final well reflected student performance in the course. This can be taken as an indication that the course and the new final are aligned.
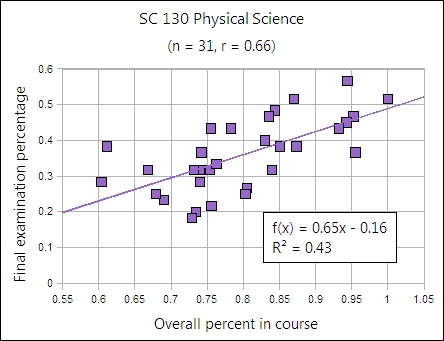
Although the course averages for the students aligned with their performance on the final examination, performance on the final was significantly below performance in the course.
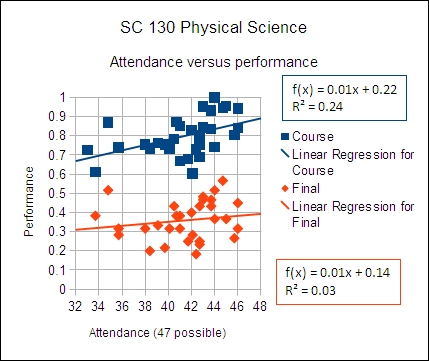
In SC 130 fall 2010 (n = 32) attendance was moderately correlated to the overall course grade (r = 0.49,
p = 0.0044) but not to performance on the final examination ( r = 0.17).
An item analysis study of student performance on the final examination as measured againt the complexity of the question yielded the following success rate data. The percentages are the percent of students answering questions correctly the specified level of complexity, averaged across all questions at that level of complexity.
| Level of complexity for the question | Percent correct |
|---|
| Single calculation | 0.38 |
| Inferred fact from data provided in question | 0.37 |
| Recall of memorized fact | 0.34 |
| Multiple calculations | 0.14 |
| Overall | 0.29 |
Students performed best on simple, single calculation items. When multiple calculations had to be strung together, the success rate fell from 38% to 14%. Students were able to look at presented data and situations and infer a fact based on that data with a 37% success rate.
Clearly the 60% mark, at least as measured by an item analysis of the final examination, was not met. Yet the course purports to measure learning primarily via the laboratory reports. How to convert that collection of 390 papers this term into assessable data without spending vast quantities of time in analysis remains an open question. Just getting the lab reports marked and back to the students in a timely fashion is a challenge for this instructor. The sheer volume of work - theoretically 416 lab reports could have been turned in - is one reason for the redesign next term. I would note that the goal is not to provide more time for assessment, but, quite frankly, to allow the instructor to have a life. The present work load is not something any other instructor is likely to want to tackle. The present work load essentially demands 48 days of non-stop work with nary a day off.
Writing
Laboratory reports were evaluated for grammar, vocabulary, organization, and cohesion. In SC 130 the grammar, vocabulary, and cohesion rubrics closely parallel that of the entrance test essay rubric. An analysis was done of laboratory two and fourteen. Grammar showed a statistically significant improvement from a mean score of 3.13 spring 2010 to 4.08 fall 2010 (p = 0.04).
Vocabulary and cohesion did not achieve a statistically significant change in their mean values at an alpha of 0.05 (p-values 0.06 and 0.07 respectively). Organization, which is based partly on following the prescribed laboratory format, showed no change.
Students were also asked in a survey given in late November whether they felt their writing skills had improved. Twenty-three students reported that they felt their writing skills had improved. No student reported that they felt their writing skills were weaker. Seven students reported that their skills probably improved. These seven used phrases such as "I think so" and "maybe." One student reported that they did not know if their writing skill had improved. One student noted that the course had improved their control of verb tenses.
Trends
Trends in the success rate of the students based on an item analysis of the final examination are without meaning due to the redesign and restructuring of the final examination in summer 2010 and then again in fall 2010. For purposes of retaining the data going forward, the following success rates per outcome are reported below. The value is the percent of the students correctly answering one (prior to summer 2010) or more questions (summer 2010 forward) on the topic area. Sp is spring, su is summer, and fa is fall term. Following the year the number of students who completed the final examination (n).
| CLO.SLO |
Sp 08 (29) |
Fa 08 (28) |
Sp 09 (31) |
Fa 09 (32) |
Sp 10 (29) |
Su 10 (28) |
Fa 10 (31) |
| 2.1 |
0.62 |
0.89 |
0.61 |
0.56 |
0.93 |
0.93 |
0.50 |
| 2.2 |
0.62 |
0.39 |
0.45 |
0.03 |
0.14 |
0.54 |
0.46 |
| 2.3 |
0.59 |
0.57 |
0.48 |
0.31 |
0.62 |
0.89 |
0.03 |
| 2.4 |
|
|
|
|
0.86 |
0.69 |
0.38 |
| 3.1 |
0.90 |
0.86 |
0.81 |
0.91 |
0.90 |
0.46 |
0.40 |
| 3.2 |
|
|
|
|
|
|
|
| 3.3 |
0.17 |
0.36 |
0.23 |
0.75 |
0.83 |
0.50 |
0.18 |
| 3.4 |
0.48 |
0.79 |
0.61 |
0.22 |
0.48 |
0.63 |
0.35 |
| 3.5 |
0.52 |
0.86 |
0.61 |
0.72 |
0.66 |
0.93 |
0.45 |
| 4.1 |
0.21 |
0.14 |
0.48 |
0.22 |
0.45 |
0.55 |
0.13 |
| 4.2 |
0.34 |
0.36 |
0.29 |
0.61 |
0.28 |
0.95 |
0.13 |
| 4.3 |
0.72 |
0.36 |
0.65 |
0.53 |
0.80 |
0.89 |
0.03 |
| 4.4 |
0.72 |
0.64 |
0.71 |
0.50 |
0.59 |
0.43 |
0.11 |
| Average: |
0.54 |
0.57 |
0.55 |
0.49 |
0.65 |
0.68 |
0.29 |