A diagram of the first three bounces of a ball
This laboratory is the midterm practical examination laboratory. In this laboratory I intentionally provide considerably less guidance on the specifics of the chart type, and analysis.
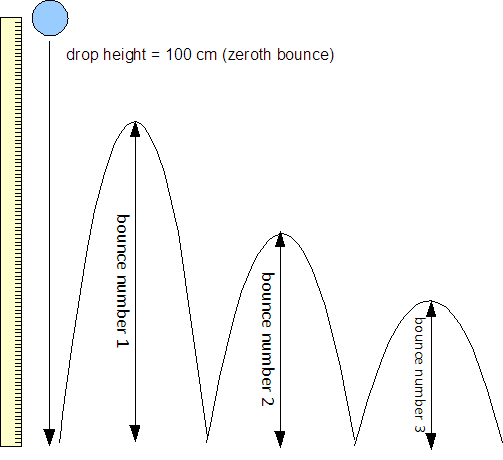
A diagram of the first three bounces of a ball
If the ball is always dropped from 100 cm, is there a mathematical relationship between the bounce number and the bounce height for that bounce?
The ball will always be dropped from a height of one hundred centimeters (one meter). This height is called "bounce number zero." Measure the height of the first bounce five times. Repeat for the height of the second bounce, third bounce, fourth bounce, and so forth.
Measure the bounce heights in centimeters.
Make a graph using an appropriate graph type to display the mathematical relationship, if any, between the bounce number x and the mean height of that bounce y.
The analysis should include answers to the following questions. Does the data appear to be modeled by a linear mathematical relationship? If not linear, is there a pattern? Is there a mathematical relationship? If you were given a bounce number, like the fourteenth bounce, could you calculate a mean bounce height from an equation? Can you predict the total number of bounces until the ball stops bouncing? Can the equation, if one exists, predict the total number of bounces? Theoretically, what does the equation say about the total number of bounces? Why does the ball stop bouncing? As you work on the data and the graphs, work with your lab partners and other classmates. Discuss the ideas that you have. Get together and share ideas.
Wrap up with a conclusion that discusses whether there is a mathematical relationship and, if so, then the nature of that relationship. Write well. Grammar, vocabulary, organization, and cohesion will still be marked.
| Bounce number x | Bounce heights (cm) | Mean bounce height y (cm) | ||||
|---|---|---|---|---|---|---|
| 0 | 100 | 100 | 100 | 100 | 100 | 100 |
| 1 | ||||||
| 2 | ||||||
| 3 | ||||||
| 4 | ||||||
| 5 | ||||||
| 6 | ||||||
| 7 | ||||||
| 8 | ||||||
| 9 | ||||||
| 10 | ||||||