- What is the population?
- What is the sample?
- What is your own opinion: Should roads be built and paved into very traditional areas
such as southern Kitti, Walung, or Rumung?
18, 19, 19, 20, 20, 21, 21, 21, 22, 22, 22, 22, 23, 23, 23, 24, 24, 25, 25, 26
- What is the range for this data?___________________________
- Divide the range into 4 intervals (classes). Record the intervals below.
Interval (Class) Tally Relative Frequency
_______________
_______________
_______________
_______________
_______________
_______________
_______________
_______________
_______________
_______________
_______________
_______________ - Tally the data into the intervals (classes) in the table above. Include your class
upper limit (CUL) in the class.
- Sketch a histogram of the data, labeling your horizontal axis as appropriate.
- Calculate the relative frequency for each interval (class) in the table above.
- Find the mode of the data ___________
- Find the median of the data ___________
- Find the mean of the data given.___________
- Calculate the (xi - mean)² values for each age value, writing the result for
each age in the table below.
Age (xi - mean)² 18 __________ 19 __________ 19 __________ 20 __________ 20 __________ 21 __________ 21 __________ 21 __________ 22 __________ 22 __________ 22 __________ 22 __________ 23 __________ 23 __________ 23 __________ 24 __________ 24 __________ 25 __________ 25 __________ 26 __________
Sum S(xi - mean)²:
__________ - Calculate the sum of the (xi - mean)² and record this in the last row of the
table above.
- What is the value of n for this data set? _____________
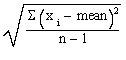
- Find the sample standard deviation of the data given using the formula: