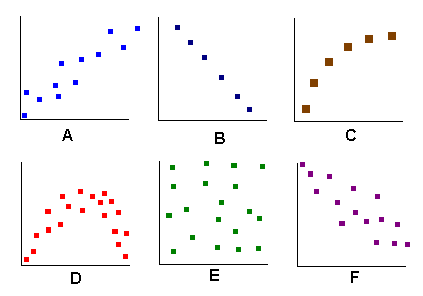

For the above six graphs circle the correct word applicable to that graph in the column:
| Shape of correlation | |
|---|---|
| A | none | linear-positive | linear-negative | non-linear |
| B | none | linear-positive | linear-negative | non-linear |
| C | none | linear-positive | linear-negative | non-linear |
| D | none | linear-positive | linear-negative | non-linear |
| E | none | linear-positive | linear-negative | non-linear |
| F | none | linear-positive | linear-negative | non-linear |
| Rainfall in inches per year for Pohnpei 1994 to 1999 x |
|---|
| 163 |
| 169 |
| 154 |
| 173 |
| 128 |
| 196 |
| Year (Year 0 is 1994) x | Total Rainfall in inches in Pohnpei y |
|---|---|
| 0 | 163 |
| 1 | 169 |
| 2 | 154 |
| 3 | 173 |
| 4 | 128 |
| 5 | 196 |
| Number of Females (F) | Number of Males (M) | Sums | |
|---|---|---|---|
| Students who prefer chicken for lunch (C) | 10 | 15 | ______ |
| Students who prefer fish for lunch (S) | 20 | 15 | ______ |
| Sums | ______ | ______ | ______ |
| Total inches of rain in Pohnpei per Month (Class Upper Limit) x | Frequency (Number of months with rainfall amounts between the CLL and CUL) | Relative Frequency P(x) | x*P(x) |
|---|---|---|---|
| 6 | 8 | _______ | _______ |
| 12 | 17 | _______ | _______ |
| 18 | 35 | _______ | _______ |
| 24 | 8 | _______ | _______ |
| 30 | 6 | _______ | _______ |
Sum: |
_______ | _______ | _______ |
| Statistic or Parameter | Symbol | Equations | Excel |
|---|---|---|---|
| Square root | =SQRT(number) | ||
| Sample mean | Sx/n | =AVERAGE(data) | |
| Sample standard deviation | sx | =STDEV(data) | |
| Sample Coefficient of Variation | CV | 100(sx/ |
=100*STDEV(data)/AVERAGE(data) |
| Slope | b | =SLOPE(y data, x data) | |
| Intercept | a | =INTERCEPT(y data, x data) | |
| Correlation | r | =CORREL(y data, x data) | |
| Coefficient of Determination | rē | =(CORREL(y data, x data))^2 |