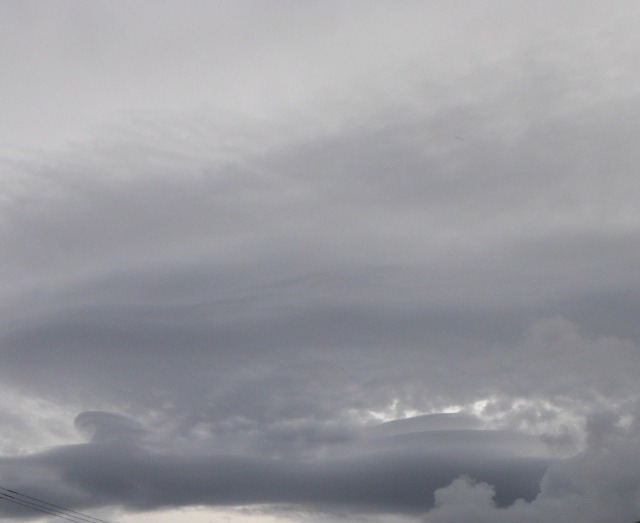
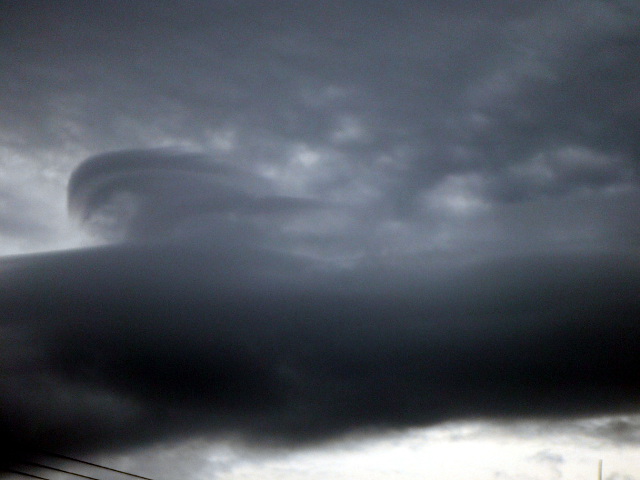
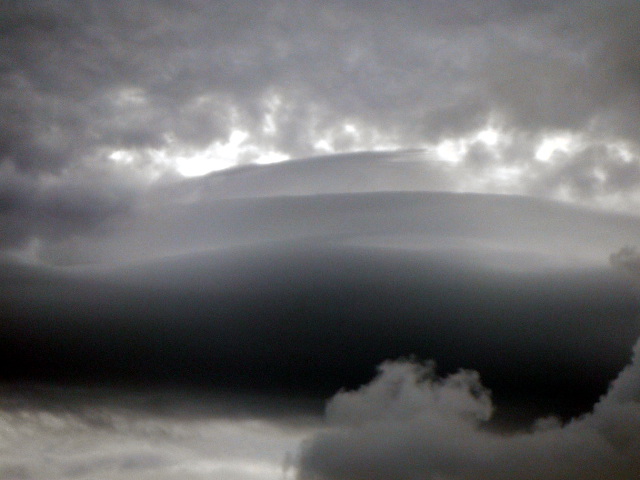
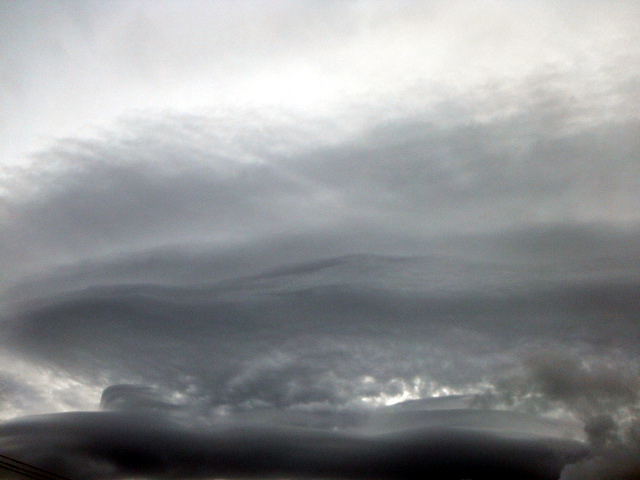
The data is wind speeds aloft in knots at the time of the images from
Tropic SSEC at the University of Wisconsin. Image will be different depending on when the image is accessed. A lower level wind on the order of 18 knots from the northeast was flowing under stronger winds aloft running at over 40 knots. Data is purely hypothetical.
What is the level of measurement?
Calculate the sample size n.
Calculate the minimum (zeroth quartile).
Calculate the first quartile.
Calculate the median (second quartile).
Calculate the third quartile.
Calculate the maximum (fourth quartile).
Calculate the Inter-Quartile Range.
Make a sketch of the box plot for this time data.
Calculate the mode.
Calculate the sample mean x.
Calculate the sample standard deviation sx.
Calculate the sample coefficient of variation CV.
Calculate the z-score for a wind speed of 46
Calculate the z-score for a wind speed of 70.
Calculate the range.
If the data is divided into five classes, what is the width of a single class?
Determine the frequencies and calculate the relative frequencies for the data.
Class upper limits
Frequency F
Rel. Freq.
Sums:
Sketch a frequency histogram for the data,
labeling your horizontal axis and vertical axis as appropriate.
