


I. Basic statistics for a single variable
Course student learning outcome one: Students will be able to perform basic statistical calculations for a single variable up to and including graphical analysis, confidence intervals, hypothesis testing against an expected value, and testing two samples for a difference of means.
| Flight segment | Distance (miles) |
|---|---|
| Pohnpei-Honolulu | 3087 |
| Honolulu-Chicago | 4242 |
| Chicago-Asheville | 532 |
| Asheville-Chicago | 532 |
| Chicago-Tokyo | 6272 |
| Tokyo-Guam | 1561 |
| Guam-Pohnpei | 1015 |
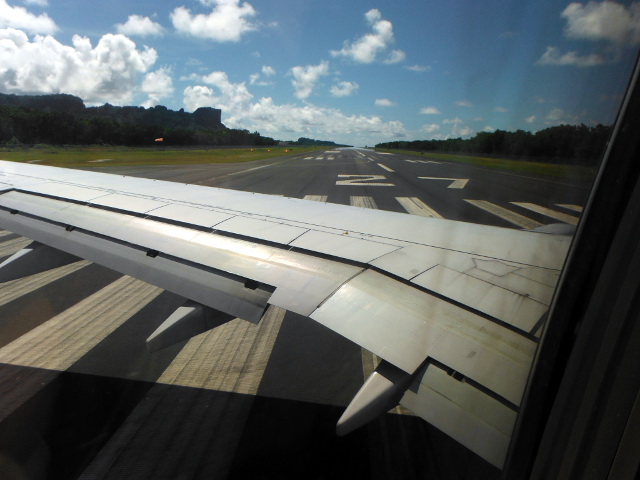
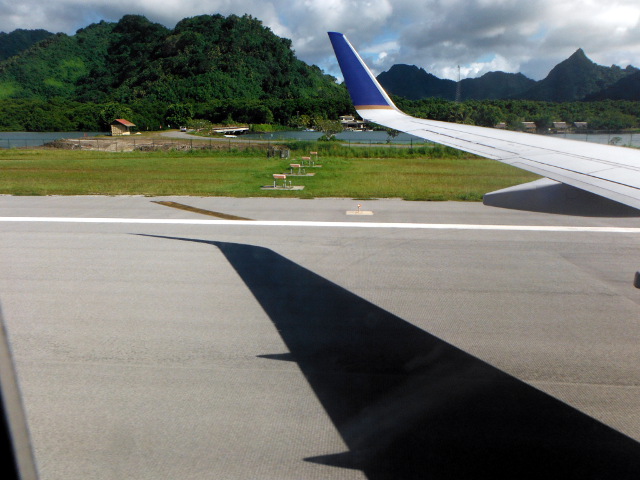
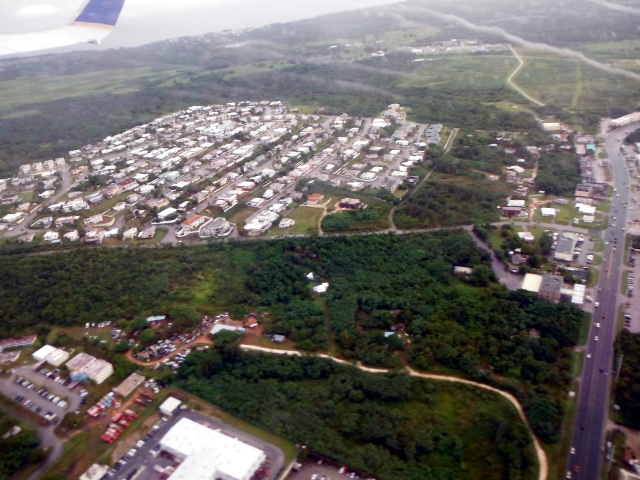
 The table is flight distances for a seven segment journey from Pohnpei to Asheville and back. Use the distance data to answer the following questions.
Data sheets
united.gnumeric
united.ods
| Class upper limits | Frequency F | Rel. Freq. |
|---|---|---|
| Sums: |
| Flight segment | Hours | Distance (miles) |
|---|---|---|
| Pohnpei-Honolulu | 10.10 | 3087 |
| Honolulu-Chicago | 8.08 | 4242 |
| Chicago-Asheville | 1.72 | 532 |
| Asheville-Chicago | 1.80 | 532 |
| Chicago-Tokyo | 13.33 | 6272 |
| Tokyo-Guam | 3.67 | 1561 |
| Guam-Pohnpei | 3.72 | 1015 |


III. Open data exploration and data analysis
Course student learning outcome three: Students will be able to engage in data exploration and analysis using appropriate statistical techniques including numeric calculations, graphical approaches, and tests.
 O'Hare |
 Narita | ||
|---|---|---|---|
| Domestic | International | Domestic | International |
| 32778 | 3988 | 4019 | 14358 |
| 34573 | 4198 | 4183 | 15349 |
| 34426 | 4215 | 4230 | 15790 |
| 31793 | 3634 | 3893 | 15014 |
| 33736 | 3996 | 3836 | 15148 |
| 30621 | 3133 | 3627 | 14342 |
| 29200 | 3245 | 3888 | 14947 |
| 24854 | 2994 | 4144 | 15125 |
| 25816 | 2805 | 3875 | 13598 |
| 31157 | 3824 | 4701 | 15783 |
| 31273 | 3479 | 4014 | 14506 |
| 32103 | 3780 | 4094 | 15011 |
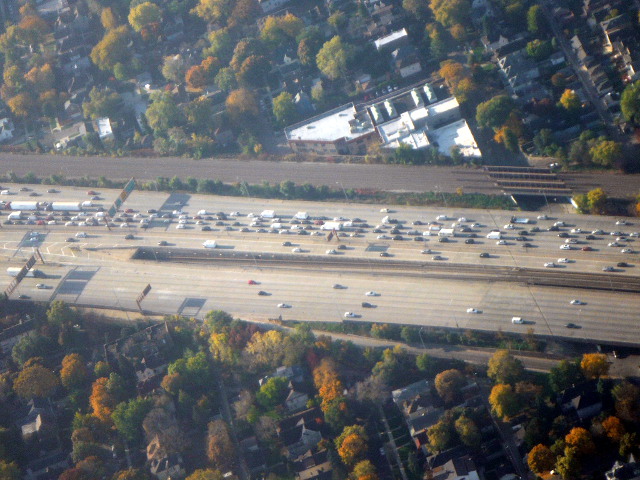
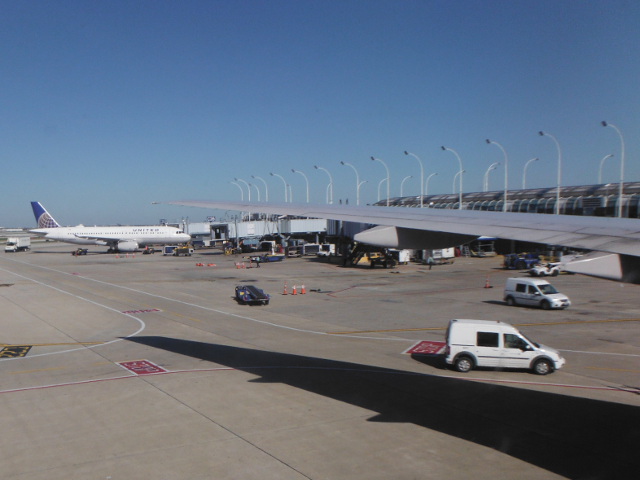
The main airport serving Chicago is O'Hare. Chicago is the headquarters of United Airlines and O'Hare serves as a central hub* for many domestic and international flights. The main airport serving Tokyo is Narita. Tokyo is the headquarters of Japan Air Lines and Narita also serves as a central hub for many domestic and international flights. The data in the tables is the number of flights per month from June 2013 to May 2014 at each airport. Both the domestic and international flights are reported. Aircraft flights include both arrivals and departures. Sources: http://www.transtats.bts.gov/Data_Elements.aspx?Data=2 and http://www.naa.jp/en/airport/traffic.html.
Provide numeric statistical support for the answers to the following questions.
Do not simply write down any and all statistics you have ever learned. Answer the questions and then cite the specific statistic, statistics, or charts that support that answer. When citing a statistic or statistics, include both the name of the statistic and the numeric value. If citing a chart, make a sketch of that chart to support your answer.
*"Airline hubs are airports that an airline uses as a transfer point to get passengers to their intended destination. It is part of a hub and spoke model, where travelers moving between airports not served by direct flights change planes en route to their destinations." - Wikipedia.