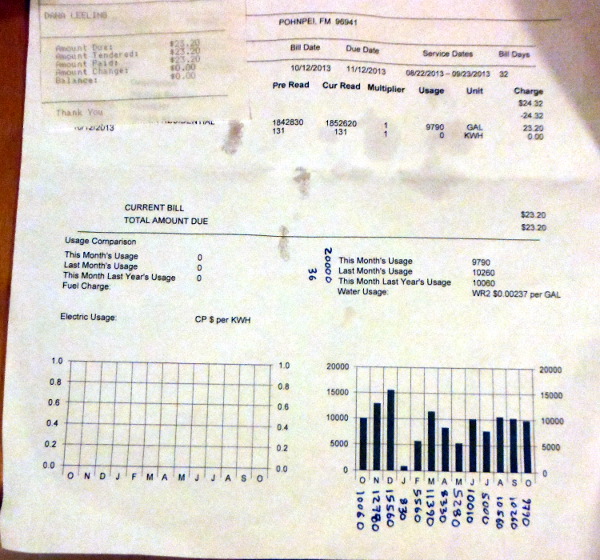
The data is the gallons of water used in a home per month in 2013.
n = __________ Calculate the sample size n.
x = __________ Calculate the sample mean x.
sx = __________ Calculate the sample standard deviation sx.
SE = __________ Calculate the standard error SE.
tc = ____________________ Given a confidence level c = 0.95, calculate tcritical
E = _________ Calculate the margin of error E for the sample mean x.
Write out the 95% confidence interval for the possible population mean μ
p(_____________ < μ < ___________) = 0.95
_______________ In 2012 the home was averaging 12800 gallons per month at an average cost of $30.34 per month.
The family in the home committed to using less water per month in 2013. Is 12800 gallons a possible population mean for the sample data?
_______________ Did the home use statistically significantly less water per month in 2013 at a confidence level of 95%?
Given a null hypothesis of H0: μ = 12800
and the alternative hypothesis of H1: μ ≠ 12800
Run a hypothesis test at a risk of a type I error alpha α = 0.05
t = ____________________ Calculate the t-statistic t
p-value = ____________________ Use =tdist(abs(t),n−1,2) to calculate the p-value.
____________________ Calculate the largest possible confidence interval which does not include 12800 by calculating 1 − p-value.
____________________ Is the sample mean x statistically significantly different from the population mean μ of 12800?
_____________________ At an alpha α of 5%, would you fail to reject|or|reject the null hypothesis?
_______________ Is the home using less water in 2013 at an alpha of 5%?