| GNH |
|---|
| 2.33 |
| 2.52 |
| 0.47 |
| 0.41 |
| 0.73 |
| 0.77 |
| 2.04 |
| 2.52 |
| 1.90 |
| 0.26 |
| 0.00 |
| 0.31 |
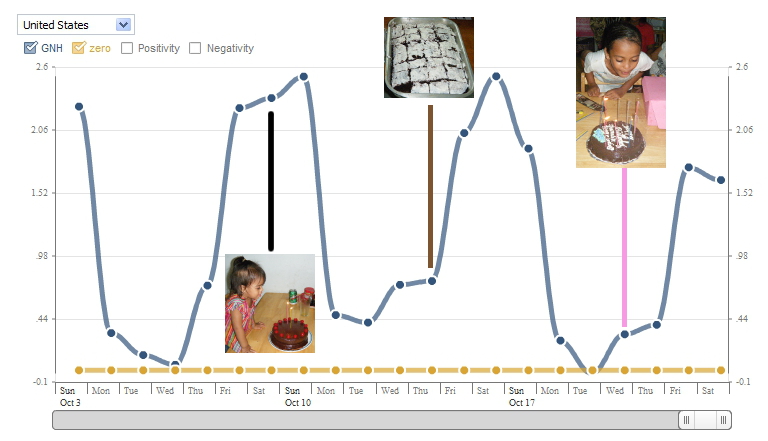
United States Gross National Happiness (GNH)
The graph represents FaceBook's measure of Gross National Happiness. There are two components of GNH: The extent to which words used on that day were positive and negative. Gross National Happiness is the difference between the positivity and negativity scores based on the number of positive and negative words used that day. Zero is a neutral day with equal positivity and negativity scores.
The data in the table is for a twelve day period in October when three members of my own family celebrate birthdays.
For the purposes of this quiz, presume that the Gross National Happiness data is normally distributed.
