| SMS per day | ratio | 1. What is the level of measurement? | ||
| 3 | 21 | 2. Find the sample size n. | ||
| 4.5 | 3 | 3. Find the minimum. | ||
| 5 | 27 | 4. Find the maximum. | ||
| 5 | 24 | 5. Find the range. | ||
| 5 | 15 | 6. Find the midrange. | ||
| 5 | 5 | 7. Find the mode. | ||
| 6 | 8 | 8. Find the median. | ||
| 7 | 10.93 | 9. Find the sample mean x. | ||
| 7 | 7.56 | 10. Find the sample standard deviation sx. | ||
| 8 | 0.69 | 11. Find the sample coefficient of variation CV. | ||
| 8 | 4 | 12. Bin width | ||
| 9 | 13. Histogram | |||
| 10 | ||||
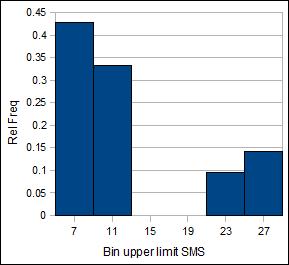
| 10 | Ball bounce bin upper limits (x) | Frequency F | Relative Frequency p(x) | |
| 10 | 7 | 9 | 0.43 | |
| 10 | 11 | 7 | 0.33 | |
| 20 | 15 | 0 | 0 | |
| 20 | 19 | 0 | 0 | |
| 25 | 23 | 2 | 0.1 | |
| 25 | 27 | 3 | 0.14 | |
| 27 | Sums: | 21 | 1 | |
| 14. Sketch a relative frequency histogram of the data | ||||
| bimodal | 15. What is the shape of the histogram? | |||
| 0.43 | 16. p(x ≤ 7) = | |||
| 0.095 | 17. p(19 < x ≤ 23) = | |||
| 50.00% | 18. p(student has cell phone) = 30/60 | |||
| More likely | 19. The probability that an FSM resident has a cell phone is estimated at 13% to 19%. | |||
|
|
||||