MS 150 Statistics quiz 04 spring 2008 • Name:
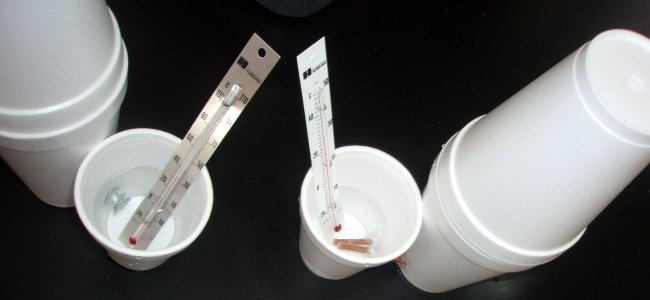
Various materials were tested for conductivity of heat. The more heat a material conducted, the higher the temperature. These temperature values were then compared to the atomic weight of the substance. Use the atomic weight data versus the max temperature on the following quiz.
Atomic weight versus max temperature
| Material | Atomic weight | Max temp |
|---|
| aluminum | 27 | 35 |
| copper | 59 | 40 |
| iron | 56 | 30 |
| SiO2 | 60 | 29 |
| zinc | 65 | 34 |
- ______________ Does the relationship between time and distance appear to be linear, non-linear, or random?
- ______________ Determine the slope of the linear regression (best fit line) for the data.
- ______________ Determine the y-intercept of the linear regression for the data.
- ______________ Determine the correlation coefficient r.
- ______________ Is the correlation positive or negative?
- ______________ How strong is the relationship?
- ______________ Determine the coefficient of determination.
- ______________ What percent in the variation in atomic weight "explains" the variation in max temperature?
- ______________ Lead has an atomic weight of 207, what would be the predicted max temperature?
- ______________ Statistically speaking, can we safely predict the max temp for lead?
- ______________ Statistically speaking, can we safely predict the max temp for any material other than those in the list?
- ______________ What is the probability of rolling a three on a six sided die numbered from one to six?
- What is the probability of an achromat (double-recessive aa) child being born to a non-achromat father (double dominant AA) and a carrier mother (heterozygous Aa)? Use a sample space diagram to help you work this one out.
-
Statistics •
Courses •
COMFSM