| taw mass/g |
|
|
|
|
|
|
|
|
| 18.46 |
|
|
|
|
|
|
|
|
| 19.24 |
|
|
|
|
|
|
|
|
| 19.3 |
|
|
|
|
|
|
|
|
| 19.85 |
|
|
|
|
|
|
|
|
| 20.12 |
|
|
|
|
|
|
|
|
| 20.12 |
|
|
|
|
|
|
|
|
| 20.33 |
|
|
|
|
|
|
|
|
| 20.35 |
|
|
|
|
|
|
|
|
| 20.52 |
|
|
|
|
|
|
|
|
| 20.78 |
|
|
|
|
|
|
|
|
| ratio |
1. What level of measurement is the data? |
|
|
|
|
|
|
|
| 10 |
2. Find the sample size n for the data. |
|
|
|
|
|
|
|
| 18.46 |
3. Find the minimum. |
|
|
|
|
|
|
|
| 20.78 |
4. Find the maximum. |
|
|
|
|
|
|
|
| 2.32 |
5. Find the range. |
|
|
|
|
|
|
|
| 20.12 |
6. Find the median. |
|
|
|
|
|
|
|
| 20.12 |
7. Find the mode. |
|
|
|
|
|
|
|
| 19.91 |
8. Find the sample mean x. |
|
|
|
|
|
|
|
| 0.71 |
9. Find the sample standard deviation sx. |
|
|
|
|
|
|
|
| 0.0356 |
10. Find the sample coefficient of variation CV. |
|
|
|
|
|
|
|
| 48.82 |
11. Determine the z-score for a taw that has a mass of 54.48 grams. |
|
|
|
|
|
|
|
| unusual |
12. Is the z-score above an ordinary or unusual z-score? |
|
|
|
|
|
|
|
| 0.22 |
13. Calculate the standard error of the mean for the taws. |
|
|
|
|
|
|
|
|
14.Calculate the 68% confidence interval for the population mean mass of a taw. |
|
|
|
|
|
|
|
| p( |
19.68 |
< μ < |
20.13 |
) = 0.68 |
|
|
|
|
|
|
|
|
|
|
|
|
|
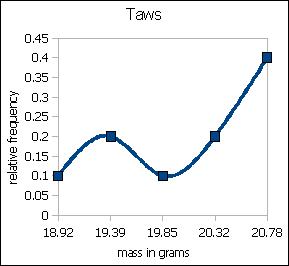
| Are the taws actually normally distributed? |
|
|
|
|
| Bins |
Freq |
Rel Freq |
|
| 18.92 |
1 |
0.1 |
|
| 19.39 |
2 |
0.2 |
|
| 19.85 |
1 |
0.1 |
|
| 20.32 |
2 |
0.2 |
|
| 20.78 |
4 |
0.4 |
|
|
10 |
1 |
|
|
|
|
|
| No, the taws are distributed strongly |
|
|
|
| skewed left and bimodally |
|
|
|
|
|
|
|
| Clue to the skew: |
|
|
|
| When the mean ≠ median, a skew is present |
|
|
|
|
|
|
|
| Skewness |
-0.97 |
|
|
| The skew function is a formula for calculating the skew in the data. The negative, non-zero value |
|
|
|
|
|
|
|
|
| is a left skew as seen in the diagram. |
|
|
|
|
|
|
|
|
| Less massive ("lighter") taws are unusual |
|
|
|
|
|
|
|
|