| Material |
ΔT/°C |
|
|
| Aluminum |
6 |
|
| Brass |
6 |
|
| Copper |
12 |
|
| Glass |
0 |
|
| Iron |
8 |
|
| Lead |
3 |
|
| Nickel |
7 |
|
| Plastic |
0 |
|
| Rubber |
0 |
|
| Steel |
11 |
|
| Tin |
7 |
|
| Wood |
0 |
|
| Zinc |
4 |
|
| ratio |
1. What level of measurement is the data? |
|
|
|
|
|
| 13 |
2. Find the sample size n for the data. |
|
|
|
|
|
| 0 |
3. Find the minimum. |
|
|
|
|
|
| 12 |
4. Find the maximum. |
|
|
|
|
|
| 12 |
5. Find the range. |
|
|
|
|
|
| 6 |
6. Find the median. |
|
|
|
|
|
| 0 |
7. Find the mode. |
|
|
|
|
|
| 4.9231 |
8. Find the sample mean x. |
|
|
|
|
|
| 4.1726 |
9. Find the sample standard deviation sx. |
|
|
|
|
|
| 0.85 |
10. Find the sample coefficient of variation CV. |
|
|
|
|
|
| 3 |
11. Width of a single bin? |
|
|
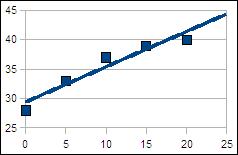
Time |
Temp/°C |
|
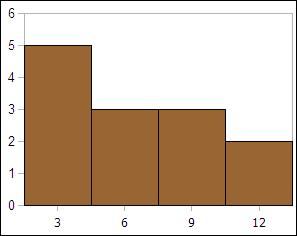
| Bins (x) |
Frequency (f) |
Rel. Freq. p(x) |
|
0 |
28 |
|
| 3 |
5 |
0.38 |
|
5 |
33 |
|
| 6 |
3 |
0.23 |
|
10 |
37 |
|
| 9 |
3 |
0.23 |
|
15 |
39 |
|
| 12 |
2 |
0.15 |
|
20 |
40 |
|
| Sum: |
13 |
1 |
|
0.6000 |
20. slope |
|
|
13. Rel freq chart |
|
|
29.4 |
21. y-intercept |
|
| skewed |
14. Shape? |
|
|
positive |
22. nature of relation |
|
| 0.98 |
15. z-score for T = 9 |
|
|
0.96 |
23. correl r |
|
| Ordinary |
|
|
|
high/strong |
24. strength |
|
| Heads |
Freq F |
Rel Freq p(x) |
x*p(x) |
Non-linear |
25. Linear? |
|
| 7 |
9 |
0.01 |
0.07 |
0.93 |
26. r² . |
|
| 6 |
41 |
0.04 |
0.26 |
34.2 |
27. T for 8 min |
|
| 5 |
167 |
0.18 |
0.89 |
1.0000 |
28. t for 30°C? |
|
| 4 |
266 |
0.28 |
1.14 |
|
| 3 |
255 |
0.27 |
0.82 |
| 2 |
139 |
0.15 |
0.3 |
| 1 |
50 |
0.05 |
0.05 |
| 0 |
7 |
0.01 |
0 |
|
934 |
1 |
3.53 |
| 0.28 |
17. p(4 heads) |
|
|
| 3.53 |
18. mean |
|
|
| normal |
19. curve name |
|
|
|
|
|
|