MS 150 Statistics test one this term came in at 47%. While only a hair over the expected range, the number suggested a possible bimodal schism developing in the course. Prompted by this single indicator, I ran a frequency analysis of scores on test one:
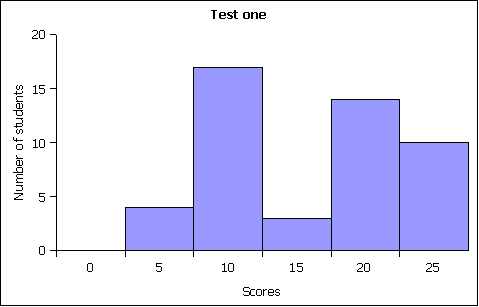
The frequency distribution confirmed the split on the test. There is precedent for this split at test one, although the sharpness of the split is stronger than I've seen before. I have come to conceive of this split as being indicative of two groups in the class. One group has been putting in a concerted effort from day one, the other group has yet to get started.
The homework completion rate in the course is at 65% (another indicator) and the correlation between homework completion and test one was 45%. While the later is only moderate correlation, the homework rate is based on four assignments. Both lend credence to the theory that some students are putting in an effort, while others have been laying back.
I track a number of possible "schism" points in my grade book. One term the average in two sections split by a statistically significant amount. I now track the 95% confidence interval for the mean by section as seen in the following snapshot at test one:
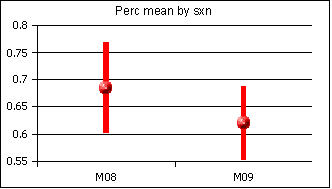
The differential between the sections is not statistically significant. In addition, there is usually a difference between the sections, with the earlier section more often outperforming the later section, despite the earlier section being plagued by more late arrival and tardy students.
The gender differential is also not statistically significant with females holding a 64% average and males holding a 66% average. The rank order of these averages is not consistent. With no statistically significant difference, one would not expect a consistent rank order.
Indicators are broad looks at groups of students. The assessment drive has been about pushing assessment down to the level of the one - the individual student. What can Johnnyleen do, what does she know, or value? Neither indicators nor item analysis provide this level of granularity, nor do grades. Grades are summative. Knowing "who has learned what and when" sometimes seems like the holy grail.
I actually did this in my ESS 101j Joggling course, tracking roughly twenty students on sixteen outcomes. That required a grid to track 320 events, with the date of accomplishment recorded in the grid. Once gained, skills were retained by the students. No student ever "forgot" knowing how to juggle after having learned to juggle.
As of test one this term 51 students have completed 49 "events" for two thousand four hundred and ninety-nine events to track by the end of the third full week of class. Simply not possible.
Even determining who is improving and who is already on a downward trend is difficult. The number of measurements, two quizzes and a test, are simply not a statistically significant sample size to generate meaningful trend data. I am running an experimental stab at this using z transformations of linear trends on percentage performance on test instruments. A small chunk of this table can be seen below. 1, 2, and 3 are the percent correct on the first two quizzes and test one.