| Micronesian homeless shelter users Year |
Number |
|
| 2001 |
286 |
| 2002 |
316 |
| 2003 |
554 |
| 2004 |
463 |
| 2005 |
513 |
| 2006 |
736 |
| ratio |
1. Level of measurement |
| 6 |
2. sample size n. |
| 478 |
3. sample mean x. |
| 488 |
4. median. |
| #VALUE! |
5. mode. |
|
Part II: Hypothesis Testing using the t-test |
|
|
| 286 |
6. minimum. |
|
Homeless shelter users Year |
Hawaiians (x) |
Micronesians (y) |
| 736 |
7. maximum. |
|
2001 |
1117 |
286 |
| 450 |
8. range. |
|
2002 |
1039 |
316 |
| 165.47 |
9. Calculate sx. |
|
2003 |
864 |
554 |
| 0.35 |
10.CV. |
|
2004 |
857 |
463 |
| 150 |
11. Class width. |
|
2005 |
756 |
513 |
|
12 |
|
2006 |
744 |
736 |
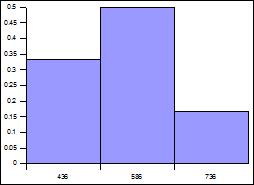
| Bins (x) |
Frequency f |
RF p(x) |
0.0209 |
21. p-value |
|
| 436 |
2 |
0.33 |
Yes |
22. Stat sig at 0.05? |
|
| 586 |
3 |
0.5 |
reject |
23. Would we fail to reject or reject... |
|
| 736 |
1 |
0.17 |
0.9791 |
24. Maximum c? |
|
| Sums: |
6 |
1 |
|
|
|
|
13. Sketch a histogram of the relative frequency data. |
|
|
|
|
| skew |
14. What is the shape of the distribution? |
|
|
|
|
| 1.56 |
15. z-score for 736 |
|
|
|
|
| ordinary |
16. Is the z-score for 736 ordinary or extraordinary value? |
|
|
|
|
| 67.55 |
17. standard error of the sample mean |
|
|
|
|
| 2.57 |
18. Find tcritical for a confidence level of 95% |
|
|
|
|
| 173.65 |
19. margin of error E for the sample mean. |
|
|
|
|
|
20. Write out the 95% confidence interval |
|
|
|
|
| 304.35 |
≤ μ ≤ |
651.65 |
|
|
|
| Micronesian shelter Users Year |
Number |
|
|
|
|
| 1 |
286 |
|
|
|
|
| 2 |
316 |
|
|
|
|
| 3 |
554 |
|
|
|
|
| 4 |
463 |
|
|
|
|
| 5 |
513 |
|
|
|
|
| 6 |
736 |
|
|
|
|
| 78.57 |
25. slope |
|
|
|
|
| 203 |
26. y-intercept |
|
|
|
|
| positive |
27. Is the correlation positive, negative, or neutral? |
|
|
|
|
| 753 |
28. predicted numberi in 07. |
|
|
|
|
| 10.14 |
29. year in which 1000 homelessin Hawaii. |
|
|
|
|
| 0.89 |
30. linear correlation coefficient r for the data. |
|
|
|
|
| high |
31. Is the correlation none, low, moderate, high, or perfect? |
|
|
|
|