 Q12 Part V: Linear Regression • Name:Q12 Part V: Linear Regression • Name:
| Location | Years of colonization (years) | Per capita gross domestic product (dollars) |
|---|---|---|
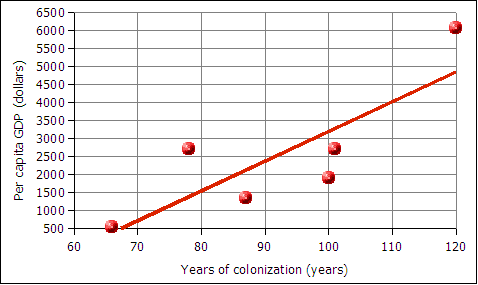
| Majuro | 100 | 1896 |
| Moen | 87 | 1335 |
| Nauru | 78 | 2702 |
| Palau | 120 | 6076 |
| Pohnpei | 101 | 2711 |
| Tarawa | 66 | 538 |
The data in this section comes from a report on years of colonization of Pacific island states and their present per capita gross domestic product (GDP). From the Wikipedia: "A region's gross domestic product, or GDP, is one of the several measures of the size of its economy. The GDP of a country is defined as the market value of all final goods and services produced within a country in a given period of time. It is also considered the sum of value added at every stage of production of all final goods and services produced within a country in a given period of time."
| Linear Regression Statistics | |||
|---|---|---|---|
| Statistic or Parameter | Symbol | Equations | OpenOffice |
| Slope | b | =SLOPE(y data; x data) | |
| Intercept | a | =INTERCEPT(y data; x data) | |
| Correlation | r | =CORREL(y data; x data) | |
| Coefficient of Determination | r2 | =(CORREL(y data; x data))^2 | |