| 1 | Column | Chart type? | ||||
| 2 | May | Max mean month? | ||||
| Pohnpei WSO Month | Rain/cm | Rain/cm | ||||
| Jun 2005 | 40 | 20 | ||||
| Jul 2005 | 36 | 23 | ||||
| Aug 2005 | 28 | 23 | ||||
| Sep 2005 | 52 | 28 | ||||
| Oct 2005 | 31 | 31 | ||||
| Nov 2005 | 35 | 35 | ||||
| Dec 2005 | 38 | 36 | ||||
| Jan 2006 | 23 | 36 | ||||
| Feb 2006 | 23 | 38 | ||||
| Mar 2006 | 20 | 40 | ||||
| Apr 2006 | 36 | 42 | ||||
| May 2006 | 45 | 45 | ||||
| Jun 2006 | 42 | 52 | ||||
| 3 | ratio | Level of measure |
|
|||
| 4 | 13 | sample size n | ||||
| 5 | 20 | min | ||||
| 6 | 52 | max | ||||
| 7 | 32 | range | ||||
| 8 | 36 | median | ||||
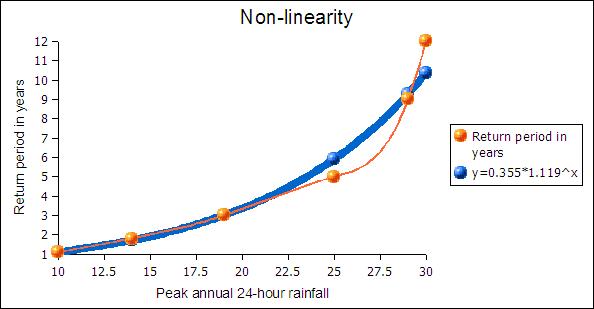
| 9 | none | mode | ||||
| 10 | 34.54 | mean | ||||
| 11 | 9.35 | stdev | ||||
| 12 | 0.27 | CV | ||||
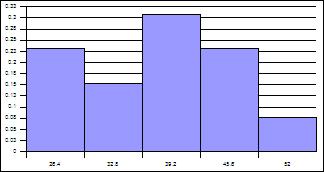
| 13 | 6.4 | width | ||||
| 14 | Bins (x) | Frequency (f) | Rel. Freq. p(x) | |||
| 26.4 | 3 | 0.23 | ||||
| 32.8 | 2 | 0.15 | ||||
| 39.2 | 4 | 0.31 | ||||
| 45.6 | 3 | 0.23 | ||||
| 52 | 1 | 0.08 | ||||
| Sum: | 13 | 1 | ||||
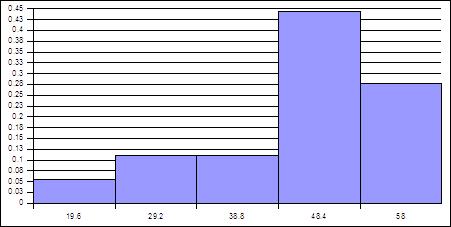
| 15 | Histogram | |||||
| 16 | bimodal/skew | Shape | 19 | 0.0059821 | slope | |
| 17 | 5.33 | z-score | 20 | -11.33 | intercept | |
| 18 | extraordinary | evaluation of z-score | 21 | positive | correlation? | |
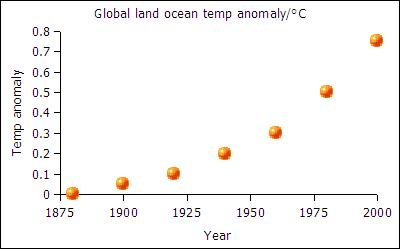
| Temperature anomalies Year (x) | Temp anomaly/°C (y) | 22 | 0.96 | r | ||
| 1880 | 0 | 23 | high/strong | strength | ||
| 1900 | 0.05 | 24 | non-linear | linearity | ||
| 1920 | 0.1 | 25 | 0.91 | coef of determination. | ||
| 1940 | 0.2 | 26 | 91.24% | variation explained | ||
| 1960 | 0.3 | 27 | 0.75 | Anomaly in 2020? | ||
| 1980 | 0.5 | 28 | 2187.16 | Year of 1.75 anomaly | ||
| 2000 | 0.75 | |||||
| Month | Rainfall/cm | 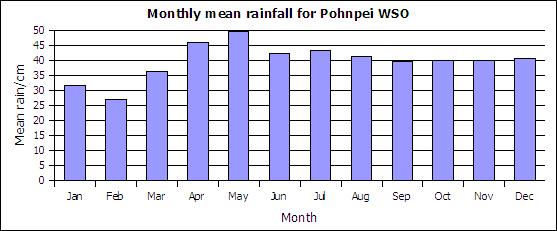
|
|||||||
| Jan | 31.55 | 12.42 | |||||||
| Feb | 27.08 | 10.66 | |||||||
| Mar | 36.2 | 14.25 | |||||||
| Apr | 45.82 | 18.04 | |||||||
| May | 49.38 | 19.44 | |||||||
| Jun | 42.34 | 16.67 | |||||||
| Jul | 43.08 | 16.96 | |||||||
| Aug | 41.17 | 16.21 | |||||||
| Sep | 39.7 | 15.63 | |||||||
| Oct | 39.98 | 15.74 | |||||||
| Nov | 40.03 | 15.76 | |||||||
| Dec | 40.67 | 16.01 | |||||||
| mean | 39.75 | ||||||||
| stdev | 5.96 | ||||||||
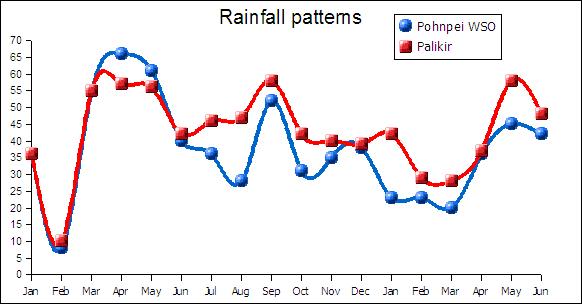
| Month | Year | Pohnpei WSO | Palikir | Nahna laud | P WSO | Palikir | Kol z | Pal z | |
| Jan | 2005 | 36 | 36 | 14.33 | 14.19 | -0.63 | -0.63 | ||
| Feb | 2005 | 8 | 10 | 3.16 | 3.91 | -5.33 | -4.99 | ||
| Mar | 2005 | 55 | 55 | 21.64 | 21.73 | 2.56 | 2.56 | ||
| Apr | 2005 | 66 | 57 | 26.11 | 22.36 | 4.4 | 2.89 | ||
| May | 2005 | 61 | 56 | 23.95 | 22.14 | 3.56 | 2.73 | ||
| Jun | 2005 | 40 | 42 | 15.64 | 16.38 | 0.04 | 0.38 | ||
| Jul | 2005 | 36 | 46 | 62 | 14.08 | 17.98 | 24.41 | -0.63 | 1.05 |
| Aug | 2005 | 28 | 47 | 64.03 | 10.84 | 18.35 | 25.21 | -1.97 | 1.22 |
| Sep | 2005 | 52 | 58 | 49.15 | 20.34 | 22.92 | 19.35 | 2.06 | 3.06 |
| Oct | 2005 | 31 | 42 | 12.17 | 16.71 | -1.47 | 0.38 | ||
| Nov | 2005 | 35 | 40 | 13.85 | 15.74 | -0.8 | 0.04 | ||
| Dec | 2005 | 38 | 39 | 14.94 | 15.22 | -0.29 | -0.13 | ||
| Jan | 2006 | 23 | 42 | 9.24 | 16.66 | -2.81 | 0.38 | ||
| Feb | 2006 | 23 | 29 | 8.88 | 11.49 | -2.81 | -1.8 | ||
| Mar | 2006 | 20 | 28 | 7.96 | 11.07 | -3.31 | -1.97 | ||
| Apr | 2006 | 36 | 37 | 71.73 | 14.12 | 14.52 | 28.24 | -0.63 | -0.46 |
| May | 2006 | 45 | 58 | 53.16 | 17.61 | 22.83 | 20.93 | 0.88 | 3.06 |
| Jun | 2006 | 42 | 48 | 16.47 | 19.07 | 0.38 | 1.38 | ||
| Kolonia | Palikir | ||||||||
| min | 20 | 10 | |||||||
| max | 52 | 58 | |||||||
| range | 32 | 48 | |||||||
| bins | 5 | 5 | |||||||
| width | 6.4 | 9.6 | |||||||
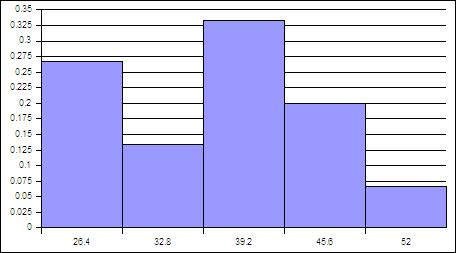
| Kolonia | Palikir | Kolonia f | Palikir f | Kol RF | Pal RF | x*P(x) | x*P(x) | ||
| 26.4 | 19.6 | 4 | 1 | 0.27 | 0.06 | 7.04 | 1.09 | ||
| 32.8 | 29.2 | 2 | 2 | 0.13 | 0.11 | 4.37 | 3.24 | ||
| 39.2 | 38.8 | 5 | 2 | 0.33 | 0.11 | 13.07 | 4.31 | ||
| 45.6 | 48.4 | 3 | 8 | 0.2 | 0.44 | 9.12 | 21.51 | ||
| 52 | 58 | 1 | 5 | 0.07 | 0.28 | 3.47 | 16.11 | ||
| 15 | 18 | 1 | 1 | 37.07 | 46.27 | ||||
| Avg: | 37.5 | 42.78 | |||||||
| Kolonia | Palikir | Kolonia f | Palikir f | Kol RF | Pal RF | x*P(x) | x*P(x) | ||
| mode | 23 | 42 | |||||||
| median | 35.5 | 42 | |||||||
| mean | 34.08 | 42.78 | |||||||
| stdev | 9.61 | 12.44 | |||||||
| CV | 0.28 | 0.29 | |||||||
| 22 | |||||||||
| 55.88 | |||||||||
| 2.71 | |||||||||
|
|||||||||
|
|||||||||
|
|||||||||
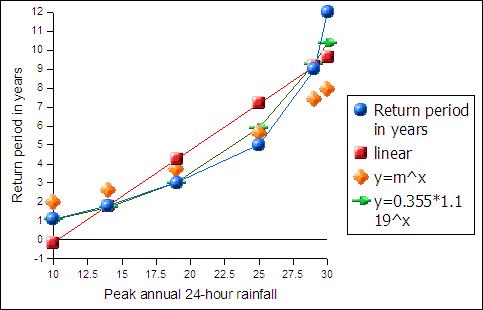
| Peak annual 24-hour rainfall | Return period in years | linear | y=m^x | y=0.355*1.119^x | inches | ||||
| 10 | 1.1 | -0.15 | 1.99 | 1.09 | slope | 0.49 | 3.75 | ||
| 14 | 1.8 | 1.81 | 2.63 | 1.71 | inter | -5.05 | 5.5 | ||
| 19 | 3 | 4.26 | 3.71 | 3.01 | r | 0.93 | 7.5 | ||
| 25 | 5 | 7.19 | 5.61 | 5.91 | 10 | ||||
| 29 | 9 | 9.15 | 7.39 | 9.27 | 11.6 | ||||
| 30 | 12 | 9.64 | 7.92 | 10.38 | 12 | ||||
| Logest | y=m^x | ||||||||
| 1.07 | 1 | ||||||||
| 0.02 | 0.54 | ||||||||
| 0.99 | 0.11 | ||||||||
| 323.07 | 4 | ||||||||
| 3.53 | 0.77 | ||||||||
| logest | y=b*m^x | ||||||||
| m | b | ||||||||
| 1.12 | 0.35 | ||||||||
| 0.01 | 0.14 | ||||||||
| 0.99 | 0.11 | ||||||||
| 323.07 | 4 | ||||||||
| 4.24 | 0.05 | ||||||||
| Peak annual 24-hour rainfall | Return period in years | ||||||||
| 12.74 | 32 | 10.62 | |||||||
| 22 | 56 | 22.38 | |||||||
| 51.15 | 20 | ||||||||
|
|||||||||
|
|||||||||
| Month | Rainfall/cm |
|
|||||||
| Jan | 31.55 | 12.42 | |||||||
| Feb | 27.08 | 10.66 | |||||||
| Mar | 36.2 | 14.25 | |||||||
| Apr | 45.82 | 18.04 | |||||||
| May | 49.38 | 19.44 | |||||||
| Jun | 42.34 | 16.67 | |||||||
| Jul | 43.08 | 16.96 | |||||||
| Aug | 41.17 | 16.21 | |||||||
| Sep | 39.7 | 15.63 | |||||||
| Oct | 39.98 | 15.74 | |||||||
| Nov | 40.03 | 15.76 | |||||||
| Dec | 40.67 | 16.01 | |||||||
| mean | 39.75 | ||||||||
| stdev | 5.96 | ||||||||
| Month | Year | Pohnpei WSO | Palikir | Nahna laud | P WSO | Palikir | Kol z | Pal z | |
| Jan | 2005 | 36 | 36 | 14.33 | 14.19 | -0.63 | -0.63 | ||
| Feb | 2005 | 8 | 10 | 3.16 | 3.91 | -5.33 | -4.99 | ||
| Mar | 2005 | 55 | 55 | 21.64 | 21.73 | 2.56 | 2.56 | ||
| Apr | 2005 | 66 | 57 | 26.11 | 22.36 | 4.4 | 2.89 | ||
| May | 2005 | 61 | 56 | 23.95 | 22.14 | 3.56 | 2.73 | ||
| Jun | 2005 | 40 | 42 | 15.64 | 16.38 | 0.04 | 0.38 | ||
| Jul | 2005 | 36 | 46 | 62 | 14.08 | 17.98 | 24.41 | -0.63 | 1.05 |
| Aug | 2005 | 28 | 47 | 64.03 | 10.84 | 18.35 | 25.21 | -1.97 | 1.22 |
| Sep | 2005 | 52 | 58 | 49.15 | 20.34 | 22.92 | 19.35 | 2.06 | 3.06 |
| Oct | 2005 | 31 | 42 | 12.17 | 16.71 | -1.47 | 0.38 | ||
| Nov | 2005 | 35 | 40 | 13.85 | 15.74 | -0.8 | 0.04 | ||
| Dec | 2005 | 38 | 39 | 14.94 | 15.22 | -0.29 | -0.13 | ||
| Jan | 2006 | 23 | 42 | 9.24 | 16.66 | -2.81 | 0.38 | ||
| Feb | 2007 | 23 | 29 | 8.88 | 11.49 | -2.81 | -1.8 | ||
| Mar | 2008 | 20 | 28 | 7.96 | 11.07 | -3.31 | -1.97 | ||
| Apr | 2009 | 36 | 37 | 71.73 | 14.12 | 14.52 | 28.24 | -0.63 | -0.46 |
| May | 2010 | 45 | 58 | 53.16 | 17.61 | 22.83 | 20.93 | 0.88 | 3.06 |
| Jun | 2011 | 42 | 48 | 16.47 | 19.07 | 0.38 | 1.38 | ||
| Kolonia | Palikir | ||||||||
| min | 8 | 10 | |||||||
| max | 66 | 58 | |||||||
| range | 58 | 48 | |||||||
| bins | 5 | 5 | |||||||
| width | 11.6 | 9.6 | |||||||
| Kolonia | Palikir | Kolonia f | Palikir f | Kol RF | Pal RF | x*P(x) | x*P(x) | ||
| 19.6 | 19.6 | 1 | 1 | 0.06 | 0.06 | 1.09 | 1.09 | ||
| 31.2 | 29.2 | 5 | 2 | 0.28 | 0.11 | 8.67 | 3.24 | ||
| 42.8 | 38.8 | 7 | 2 | 0.39 | 0.11 | 16.64 | 4.31 | ||
| 54.4 | 48.4 | 2 | 8 | 0.11 | 0.44 | 6.04 | 21.51 | ||
| 66 | 58 | 3 | 5 | 0.17 | 0.28 | 11 | 16.11 | ||
| 18 | 18 | 1 | 1 | 43.44 | 46.27 | ||||
| Avg: | 37.5 | 42.78 | |||||||
| Kolonia | Palikir | Kolonia f | Palikir f | Kol RF | Pal RF | x*P(x) | x*P(x) | ||
| mode | 36 | 42 | |||||||
| median | 36 | 42 | |||||||
| mean | 37.5 | 42.78 | |||||||
| stdev | 14.77 | 12.44 | |||||||
| CV | 0.39 | 0.29 | |||||||
| 22 | |||||||||
| 55.88 | |||||||||
| 2.71 | |||||||||
|
|
|||||||||

|
|||||||||
|
|
|||||||||
| 1880 | 0 | 0.3 | |||||||
| 1900 | 0.05 | 0.35 | |||||||
| 1920 | 0.1 | 0.4 | |||||||
| 1940 | 0.2 | 0.5 | |||||||
| 1960 | 0.3 | 0.6 | |||||||
| 1980 | 0.5 | 0.8 | |||||||
| 2000 | 0.75 | 1.05 | |||||||
| 0.005982 | |||||||||
| -11.33 | |||||||||
| 0.96 | |||||||||
|
|||||||||