MS 150 Statistics quiz three 4.2 linear regression • Name:
For the following six graphs, determine whether the relationship is linear, non-linear, or random; and, if linear, determine whether it is positive or negative.
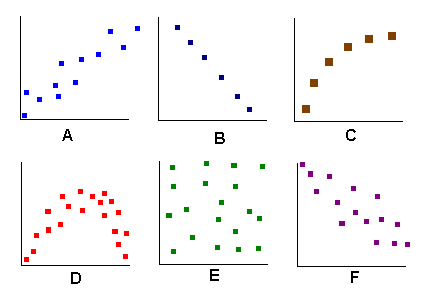
| Type of relationship | Positive|negative |
|---|
| A. | | |
| B. | | |
| C. | | |
| D. | | |
| E. | | |
| F. | | |
Averages
| Su 02 (x) | MS 150 (y) |
|---|
| 63 | 79 |
| 77 | 62 |
| 78 | 62 |
| 83 | 56 |
| 72 | 60 |
| 89 | 41 |
In the summer of 2002 twenty-three students enrolled in an upward bound computer applications class. These students had graduated elementary school, thus the course occurred prior to contact with the high school. In the spring of 2006, six of those twenty-three students enrolled in MS 150 Statistics. The data in the table shows the averages for these six students. Consider the summer 2002 computer applications course average as the x data and the spring 2006 MS 150 average as the y data. The numbers are averages expressed as points out of one hundred.
- ______________ Calculate the slope of the linear regression (trend line) for the data.
- ______________ Calculate the y-intercept of the linear regression (trend line) for the data.
- ______________ Is the correlation positive or negative?
- ______________ Use the slope and intercept to calculate the predicted average in MS 150 for a student with a 68 average in the summer of 2002.
- ______________ Use the slope and intercept to calculate the summer 2002 average for which the MS 150 average is 48.
- __________ Determine the correlation coefficient r.
- __________ Is the correlation none, weak, moderate, strong, or perfect?
- __________ Does the relationship appear to be linear or non-linear?
- __________ Determine the coefficient of determination.
- __________ What percent in the variation in the summer 2002 average accounts for the variation in the MS 150 average?
- Which inference would you make about these six students...
- Students who did well during the summer of 2002 are doing well in MS 150, students who did poorly during the summer of 2002 are doing poorly in MS 150 spring 2006. OR
- Students who did poorly during the summer of 2002 are doing well in MS 150, students who did well in the summer of 2002 are doing poorly in MS 150 spring 2006.
- In this case, is there causation?
- Why or why not?
| Linear Regression Statistics |
|---|
| Statistic or Parameter | Math symbol | Stat symbol | Excel |
|---|
| Slope | m | b | =SLOPE(y data, x data) |
| Intercept | b | a | =INTERCEPT(y data, x data) |
| Correlation | r | =CORREL(y data, x data) |
| Coefficient of Determination | r2 |
=(CORREL(y data, x data))^2 |
Statistics •
Lee Ling •
COMFSM