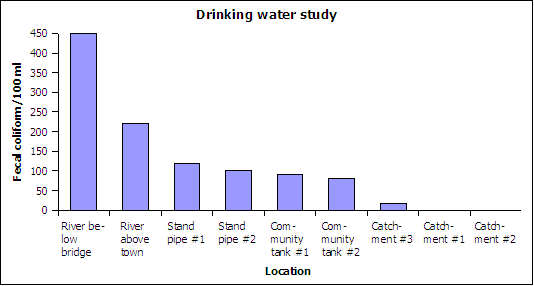
| 1 | Pareto (2) column (1) | Chart type | |||
| Blood sugar mg/dl | |||||
| 86 | |||||
| 89 | |||||
| 94 | |||||
| 100 | |||||
| 100 | |||||
| 106 | |||||
| 110 | |||||
| 131 | |||||
| 158 | |||||
| 196 | |||||
| 2 | ratio | level of measure | |||
| 3 | 10 | sample size | |||
| 4 | 86 | minimum | |||
| 5 | 196 | maximum | |||
| 6 | 110 | range | |||
| 7 | 103 | median | |||
| 8 | 100 | mode | |||
| 9 | 117 | mean | |||
| 10 | 35.18 | sx | |||
| 11 | 0.3007 | CV | |||
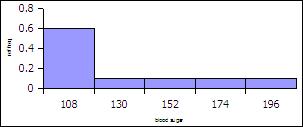
| 12 | 22 | Width | |||
| 13 | Bins (x) | Frequency (f) | Rel. Freq. p(x) | ||
| 108 | 6 | 0.6 | |||
| 130 | 1 | 0.1 | |||
| 152 | 1 | 0.1 | |||
| 174 | 1 | 0.1 | |||
| 196 | 1 | 0.1 | |||
| Sum: | 10 | 1 | |||
| 14 | See chart | ||||
| 15 | skewed | shape | |||
| 16 | z-score 0.23: ordinary | µ of 105, σ of 13. x=108 | |||
| 17 | z-score 2.4: unusual | µ of 94, σ of 15. x=130 | |||
| 18 | 30.9 | Mean BMI | |||
| 19 | obese | Overweight, obese, or neither? | |||
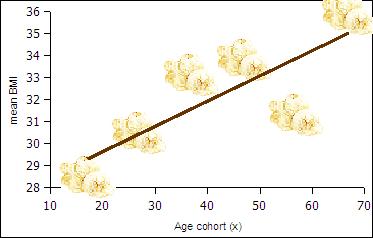
| BMI by age Age cohort (x) | mean BMI (y) | ||||
| 17 | 28.5 | ||||
| 27 | 30.5 | ||||
| 37 | 33.1 | ||||
| 47 | 33.8 | ||||
| 57 | 31.3 | ||||
| 67 | 35.9 | ||||
| 20 | 0.11 | slope | |||
| 21 | 27.37 | intercept | |||
| 22 | positive | correlation | |||
| 23 | 0.82 | r | |||
| 24 | high/strong | strength of correlation | |||
| 25 | linear | linear? | |||
| 26 | 0.67 | Coefficient of determination. | |||
| 27 | 67% | What % in the variation... | |||
| 28 | 31.04 | 32 | |||
| 29 | 22.94 | 30 | |||
| 30 | No | ||||
| 31 | No | Seven year old BMI? | |||
| beyond the data | Why or why not? | ||||
|
|
|||||