| Interhill data |
Distance (m) |
|
|
|
|
| Paies to Snowland hill |
945 |
|
|
|
|
| Snowland hill to Irohir |
1020 |
|
|
|
|
| Irohir to 3rd hill |
405 |
|
|
|
|
| 3rd hill to Nankapw |
1385 |
|
|
|
|
| Nankapw to 3rd hill |
1385 |
|
|
|
|
| 3rd hill to Irohir |
393 |
|
|
|
|
| Irohir to Snowland hill |
1035 |
|
|
|
|
| Snowland to Paies |
945 |
|
|
|
|
| 1 |
ratio |
Level of measure? |
| 2 |
8 |
Find the sample size n for the interhill distance data. |
| 3 |
393 |
Find the minimum interhill distance. |
| 4 |
1385 |
Find the maximum interhill distance. |
| 5 |
992 |
Find the range of the interhill distance. |
| 6 |
982.5 |
Find the median interhill distance. |
| 7 |
None |
Find the mode for the interhill distance. |
| 8 |
939.13 |
Find the sample mean x interhill distance. |
| 9 |
377.39 |
St dev |
|
|
|
| 10 |
0.4019 |
Find the sample coefficient of variation CV. |
| 11 |
248 |
Four bin width? |
|
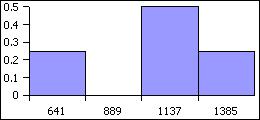
| 12. Bins (x) |
Frequency (f) |
Rel. Freq. p(x) |
| 641 |
2 |
0.25 |
| 889 |
0 |
0 |
| 1137 |
4 |
0.5 |
| 1385 |
2 |
0.25 |
| Sum: |
8 |
1 |
| 13 |
|
RF histogram |
| 14 |
bimodal |
What is the shape of the distribution? |
|
| Bin |
Freq |
RF or p(x) |
x*p(x) |
|
|
| 2 |
0 |
0 |
0 |
|
|
| 3 |
7 |
0.44 |
1.31 |
|
|
| 4 |
5 |
0.31 |
1.25 |
|
|
| 5 |
4 |
0.25 |
1.25 |
|
|
| Sums: |
16 |
1 |
3.81 |
|
|
| 15 |
3.81 |
What is the mean? |
|
|
|
| 16 |
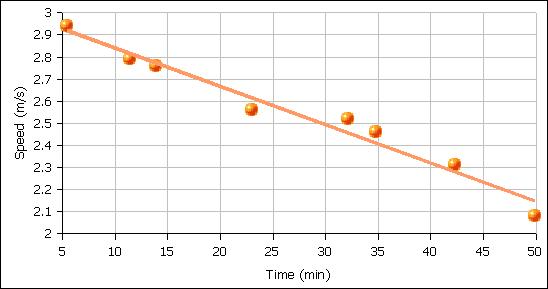
-0.0174 |
slope |
Interhill data |
Time (min) |
Speed (m/s) |
| 17 |
3.0144 |
intercept |
Paies to Snowland hill |
5.4 |
2.94 |
| 18 |
negative |
sign of corr |
Snowland hill to Irohir |
11.4 |
2.79 |
| 19 |
-0.9849 |
correlation |
Irohir to 3rd hill |
13.9 |
2.76 |
| 20 |
high |
degree of corr |
3rd hill to Nankapw |
23 |
2.56 |
| 21 |
linear |
linear? |
Nankapw to 3rd hill |
32.1 |
2.52 |
| 22 |
0.9700 |
Coef Det |
3rd hill to Irohir |
34.8 |
2.46 |
| 23 |
97.00% |
Percent variation |
Irohir to Snowland hill |
42.3 |
2.31 |
| 24 |
3.01 |
start speed at t=0 |
Snowland to Paies |
49.9 |
2.08 |
| 25 |
1.97 |
speed at t=60 |
|
|
|
| 26 |
slowing down |
What is happening? |
|
|
|
| 27 |
tiring/variable |
Why? |
|
|
|
| Some answered "Why is he slowing down?" others answered "Why did I conclude he is slowing down?" |
|
|
|
|
|
|
|
|
|
|
|
|
|
| Is the data non-linear? There is no obvious curve to the data: the trend line splits data |
|
| left and right. The line appears to well match the data at the endpoints and the data |
|
| at the midpoints. The data shows a runner continously slowing down. |
|
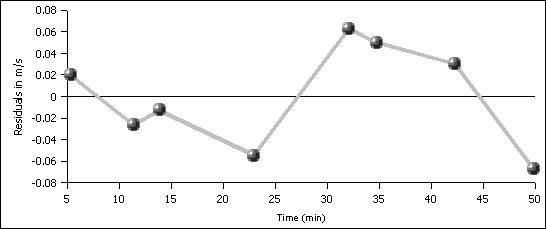
| A residual analysis will help satisfy more statisically advanced readers. |
|
|
|
|
|
|
|
| Time (min) |
Speed (m/s) |
Predicted |
Residuals |
Standard Err |
|
| 5.4 |
2.94 |
2.92 |
0.02 |
0.0004 |
|
| 11.4 |
2.79 |
2.82 |
-0.03 |
0.0007 |
|
| 13.9 |
2.76 |
2.77 |
-0.01 |
0.0002 |
|
| 23 |
2.56 |
2.62 |
-0.06 |
0.0030 |
|
| 32.1 |
2.52 |
2.46 |
0.06 |
0.0040 |
|
| 34.8 |
2.46 |
2.41 |
0.05 |
0.0025 |
|
| 42.3 |
2.31 |
2.28 |
0.03 |
0.0009 |
|
| 49.9 |
2.08 |
2.15 |
-0.07 |
0.0046 |
|
|
|
|
|
0.0162 |
|
|