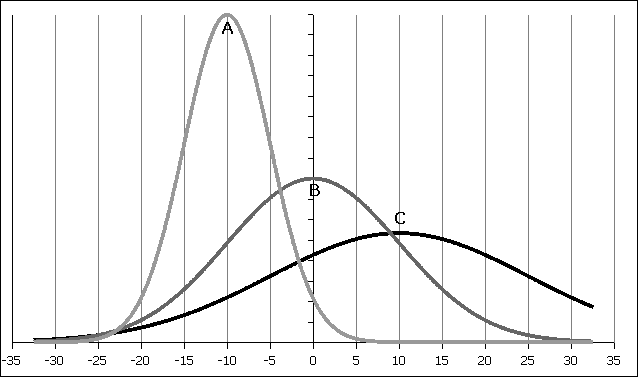
1. For the following curves A, B, and C determine the mean µ and the standard deviation
σ:
| Curve | Mean µ | standard deviation σ |
|---|---|---|
| A | ||
| B | ||
| C |
| Dist/meters |
|---|
| 441 |
| 433 |
| 433 |
| 434 |
| 436 |
| 437 |
| 441 |
| 436 |
| 444 |
2. Using global positioning satellite systems, the length of lane four at the Pohnpei state track facility was measured nine times. Use the data above to determine the sample mean x and the sample standard deviation sx. Use this data to calculate a 95% confidence interval for the population mean lane four length.
| Confidence interval statistics | |||
|---|---|---|---|
| Find a tc value from a confidence level c and sample size n | tc | =TINV(1-c,n-1) | |
| Calculate an error tolerance E of a mean for any n ≥ 5 using sx. | E | =tc*sx/SQRT(n) | |
| Calculate a confidence interval for a population mean µ from a sample mean x and an error tolerance E | x-E≤ µ ≤x+E | ||