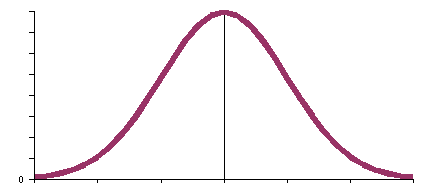
A sample size n of 19 female students in MS 150 statistics spring 2005 had their body fat measured. The sample mean body fat x is 30.16 with a sample standard deviation sx of 9.54. Construct a 95% confidence interval for a population mean female body fat among females students at the national campus. Note that n ≤ 30.

| Confidence interval statistics | |||
|---|---|---|---|
| Find a tc value from a confidence level c and sample size n | tc | =TINV(1-c,n-1) | |
| Calculate an error tolerance E of a mean for any n ≥ 5 using sx. | E | =tc*sx/SQRT(n) | |
| Calculate a confidence interval for a population mean µ from a sample mean x and an error tolerance E | x-E≤ µ ≤x+E | ||