|
fish/25m |
|
|
|
0 |
|
|
|
3 |
|
|
0 |
|
|
10 |
|
|
4 |
|
|
3 |
|
|
3 |
|
|
0 |
|
|
3 |
|
|
1 |
|
|
3 |
|
|
10 |
|
|
1 |
|
|
8 |
|
|
8 |
|
|
10 |
|
|
|
8 |
|
|
|
15 |
|
|
|
20 |
|
|
|
5 |
|
|
| 1 |
ratio |
What level of measurement is the data? |
|
| 2 |
20 |
Determine the sample size n. |
|
| 3 |
5.75 |
Calculate the sample mean x. |
|
| 4 |
3.5 |
Determine the median. |
|
| 5 |
3 |
Determine the mode. |
|
| 6 |
0 |
Determine the minimum. |
|
| 7 |
20 |
Determine the maximum. |
|
| 8 |
20 |
Calculate the range. |
|
| 9 |
5.35 |
Calculate the sample standard deviation sx. |
|
| 10 |
0.93 |
Calculate the sample Coefficient of Variation. |
|
| 11 |
4 |
Determine the class width. Use 5 bins |
|
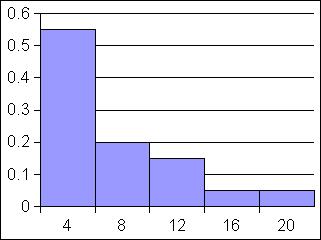
| 12 |
Bins |
Frequency |
RF f/n |
| 13 |
4 |
11 |
0.55 |
|
8 |
4 |
0.2 |
|
12 |
3 |
0.15 |
|
16 |
1 |
0.05 |
|
20 |
1 |
0.05 |
|
Sums: |
20 |
1 |
|
|
|
|
| 14 |
skewed |
What is the shape of the distribution? |
|
| 15a |
5.75 |
_What is the point estimate for the population mean µ? |
|
| 15b |
19 |
df = _How many degrees of freedom? |
|
| 15c |
2.09 |
tc = _What is tc? |
|
| 15d |
2.5 |
Error tolerance E |
|
| 15e |
3.25 |
≤ µ ≤ |
8.25 |
| 16a |
|
Ho: µ = 5.75 |
|
| 16b |
|
h1: µ ≠ 5.75 |
|
| 16c |
0.05 |
alpha α = _Write down the level of significance. |
|
| 16d |
3.18 |
tc = _What is tc? |
|
| 16e |
1.84 |
t = _Calculate the t-statistic. |
|
| 16f |
0.1633 |
p = _Determine the p-value using the t-distribution. |
|
| 16g |
0.8367 |
Max c |
|
| 16h |
fail to reject |
Reject or fail to? |
|
| 16i |
0.16 |
Risk of type I error |
|
| 16j |
no |
At a=0.01? |
|
|
|
Part Two: Regression and Correlation |
|
|
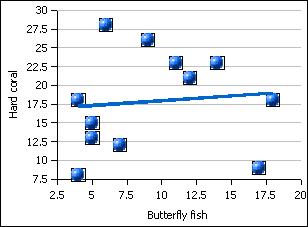
Butterfly |
Coral |
|
|
4 |
8 |
|
|
5 |
15 |
|
|
17 |
9 |
|
|
7 |
12 |
|
|
5 |
13 |
|
|
14 |
23 |
|
|
12 |
21 |
|
|
18 |
18 |
|
|
4 |
18 |
|
|
6 |
28 |
|
|
9 |
26 |
|
|
11 |
23 |
|
| 19 |
0.13 |
slope |
|
| 20 |
16.6 |
intercept |
|
| 21 |
pos |
Is the correlation positive, negative, or neutral? |
|
| 22 |
18.58 |
x=15 |
|
| 23 |
10.59 |
y=18 |
|
| 24 |
0.1013 |
Reject or fail to? |
|
| 25 |
low |
strength? |
|
| 26 |
0.0103 |
Calculate the coefficient of determination. |
|
| 27 |
1.03% |
Percent variation... |
|
| 28 |
no |
Is there a relationship? |
|
| 29 |
no |
Can we accurately predict... |
|
|
correl is weak |
Why or why not? |
|