| MS 150 Statistics Quiz 6 Pennies · Name: | ||||||||
| Heads | Frequency | Relative Freq | ||||||
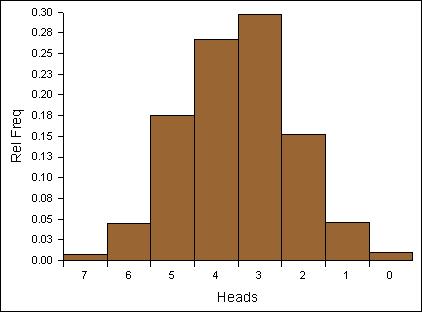
| 7 | 8 | 0.01 | 0.05 | |||||
| 6 | 45 | 0.04 | 0.26 | |||||
| 5 | 179 | 0.18 | 0.88 | |||||
| 4 | 272 | 0.27 | 1.07 | |||||
| 3 | 303 | 0.30 | 0.89 | |||||
| 2 | 155 | 0.15 | 0.3 | |||||
| 1 | 47 | 0.05 | 0.05 | |||||
| 0 | 10 | 0.01 | 0 | |||||
| 1019 | 1 | 3.51 | ||||||
| Based on the relative frequency data above... | ||||||||
| 1 | ________ | What is the probability of five heads and two tails on a throw of seven pennies? | ||||||
| 2 | ________ | What is the probability of two or fewer heads on a throw of seven pennies? | ||||||
| 3 | ________ | What is the average number of heads that come up on tosses of seven pennies? | ||||||
| (The answer to three is a single specific number) | ||||||||
| 4 | ________ | What is the shape of the distribution below? | ||||||
| 5 | ________ | Were you told to toss the pennies in a way that would yield the shape seen below? | ||||||
|
|
||||||||