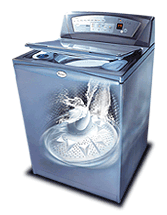

Three years ago the Whirlpool Corporation was designing their new Whirlpool Calypso™ washing machine. Without an agitator that twists back and forth in the center of the wash basket, the Calypso washer cleans clothes an entirely new way. A "Nutate" wash motion gently bounces clothes through a continuous shower of detergent and water. The action is kinder to fabrics because it's designed to provide better cleaning with less stress to garment fibers. The new washing machine uses 50% less water and 66% less energy than the average conventional washer and delivers the largest usable capacity of any high efficiency vertical axis washer. The Whirlpool Corporation contracted MSC.Adams Software to design a new brake to stop the wash basket. Developing the brake was a challenge on this washer because it spins at 800 rpm, as opposed to 640 rpm for Whirlpool Corporation's traditional washers, and it also has a larger capacity that encourages consumers to load it with bigger wash loads. The brakes on early prototype washers didn't meet the company's tough product specifications. As a result of Computer Aided Design, a new brake was designed and tested in a prototype washer. The time in seconds to stop the basket for twenty trial runs of the prototype were measured.
| Brake time/sec |
|---|
| 4.7 |
| 4.9 |
| 4.9 |
| 5.0 |
| 5.1 |
| 5.2 |
| 5.2 |
| 5.3 |
| 5.3 |
| 5.3 |
| 5.4 |
| 5.4 |
| 5.4 |
| 5.5 |
| 5.6 |
| 5.7 |
| 5.7 |
| 5.8 |
| 5.9 |
| 6.1 |
For the brake time:
| Bins | Frequency | Relative Frequency f/n |
|---|---|---|
| _________ | _________ | _________ |
| _________ | _________ | _________ |
| _________ | _________ | _________ |
| _________ | _________ | _________ |
| _________ | _________ | _________ |
| Sums: | _________ | _________ |
 __________ The early prototype brakes that did not meet specifications took 5.75 seconds to bring the basket to a stop. Based on the above data and a 95% confidence level, are the new brakes statistically significantly faster at stopping the wash basket?
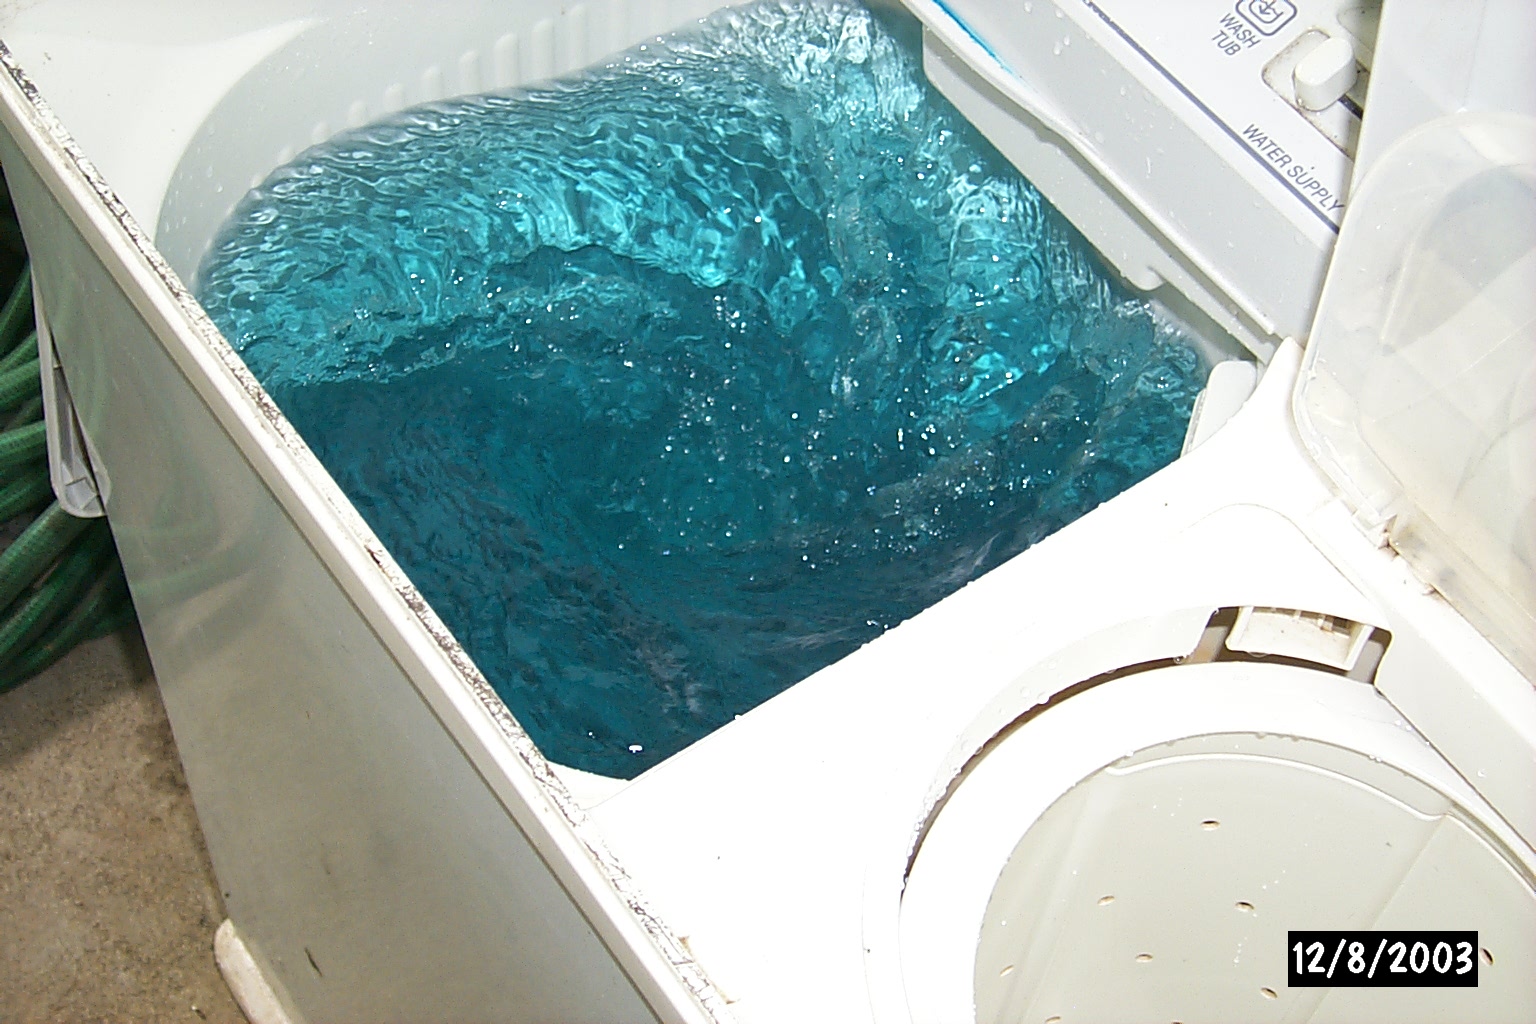
A Sanyo 256T washer forms a whirlpool in the wash tub during the wash cyle. The depth of the center of the whirlpool is proportional to the rotation rate of the water. The following data was recorded.
| Rotations/second | Depth of whirlpool/cm |
|---|---|
| 0.0 | 0 |
| 1.0 | 6 |
| 1.5 | 11 |
| 2.0 | 16 |
 _________ Use the inverse of the best fit line equation to calculate the rotation rate that would produce a whirlpool depth of 13 cm.
| Basic Statistics | |||
|---|---|---|---|
| Statistic or Parameter | Symbol | Equations | Excel |
| Square root | =SQRT(number) | ||
| Sample size | n | =COUNT(data) | |
| Sample mean | x | Sx/n | =AVERAGE(data) |
| Sample standard deviation | sx or s | =STDEV(data) | |
| Sample Coefficient of Variation | CV | 100(sx/x) | =100*STDEV(data)/AVERAGE(data) |
| Linear Regression Statistics | |||
|---|---|---|---|
| Statistic or Parameter | Symbol | Equations | Excel |
| Slope | b | =SLOPE(y data, x data) | |
| Intercept | a | =INTERCEPT(y data, x data) | |
| Correlation | r | =CORREL(y data, x data) | |
| Coefficient of Determination | r2 | =(CORREL(y data, x data))^2 | |
| Statistic or Parameter | Symbol | Equations | Excel |
|---|---|---|---|
| Normal Statistics | |||
| Calculate a z value from an x | z | = |
=STANDARDIZE(x, µ, s) |
| Calculate an x value from a z | x | = s z + µ | =s*z+µ |
| Calculate a t-statistic (t-stat) | t |  |
=(x - µ)/(sx/SQRT(n)) |
| Calculate an x from a z | =µ + zc*sx/sqrt(n) | ||
| Find a probability p from a z value | =NORMSDIST(z) | ||
| Find a z value from a probability p | =NORMSINV(p) | ||
| Confidence interval statistics | |||
| Degrees of freedom | df | = n-1 | =COUNT(data)-1 |
| Find a zc value from a confidence level c | zc | =ABS(NORMSINV((1-c)/2)) | |
| Find a tc value from a confidence level c | tc | =TINV(1-c,df) | |
| Calculate an error tolerance E of a mean for n >= 30 using sx | E | =zc*sx/SQRT(n) | |
| Calculate an error tolerance E of a mean for n < 30 using sx. Can also be used for n >= 30. | E | =tc*sx/SQRT(n) | |
| Calculate a confidence interval for a population mean µ from a sample mean x and an error tolerance E | x-E<= µ <=x+E | ||
| Hypothesis Testing | |||
| Calculate t-critical for a two-tailed test | tc | =TINV(a,df) | |
| Calculate a p-value from a t-statistic | p | = TDIST(ABS(tstat),df,#tails) | |